
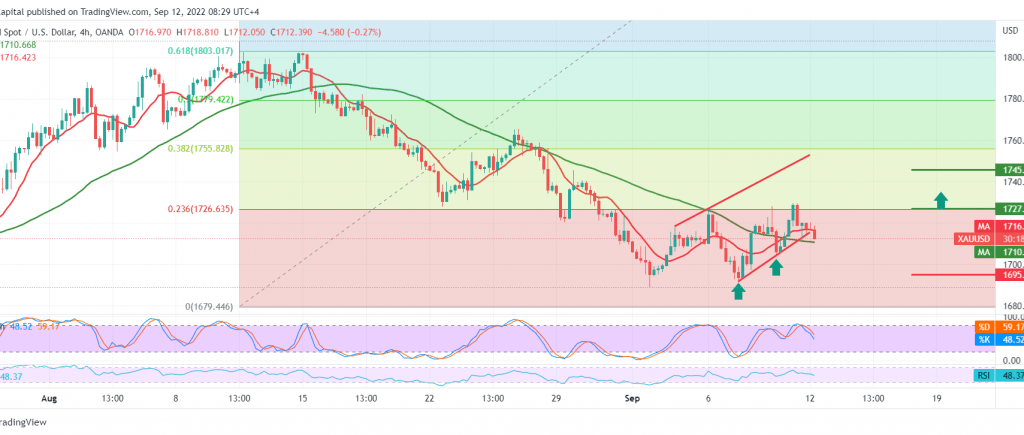
Positive trades dominated gold’s movements within the expected bullish context, touching our awaited target at 1730, and recording its highest level at 1729.
Technically, gold prices found a strong resistance level around 1726 represented by the 23.60% Fibonacci correction as shown on the 4-hour chart. It started by pressing the 50-day simple moving average, accompanied by the clear negative signs on the stochastic indicator.
We may witness a bearish tendency in the coming hours, targeting 1703 first target and then 1695 before attempts to rise again.
If the price succeeds in breaching 1726, we must pay close attention, which will postpone the chances of descending, and we see an upward trend, its initial targets starting at 1737 and extending to visit 1745.
Note: Trading on CFDs involves risks. Therefore, all scenarios may be possible. This article is not a recommendation to buy or sell but rather an explanatory reading of the price movement on the chart.
| S1: |