Gold prices (XAU/USD) traded sideways within a narrow range during the previous session, remaining stable above the $5,000 level and capped below $5,088, reflecting a temporary pause as the market awaits fresh catalysts.
Technical Outlook – 4-Hour Chart
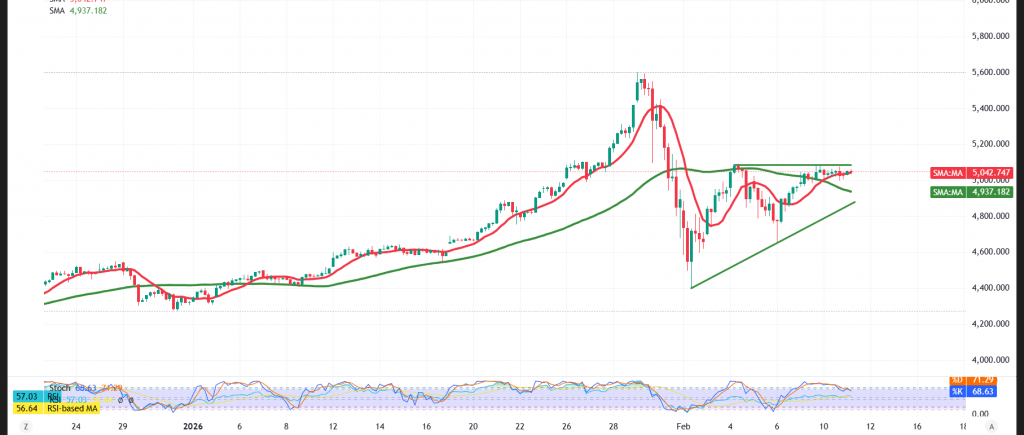
Daily Trend: Bullish
The broader daily trend remains firmly bullish, supported by sustained trading above the $5,000 level, which has turned into a pivotal support zone following the breakout.
On the intraday level, gold witnessed a mild pullback as the Relative Strength Index (RSI) moved into overbought territory and is now attempting to rebuild positive momentum. This behavior is consistent with a healthy consolidation rather than a trend reversal.
Simple moving averages continue to provide strong dynamic support, preserving the short-term upward structure. A minor bullish sub-wave remains dominant in the immediate timeframe, reinforcing the positive bias.
Likely Scenario
The bullish bias is expected to remain in control during today’s session. A confirmed break above the $5,086 level would strengthen upside momentum and open the way toward $5,128, followed by $5,145 as the next initial targets.
On the downside, a return to trading below the $5,000 level would increase downside risks and could trigger a corrective move toward $4,970 and then $4,910 before the next directional assessment.
Market Note:
High-impact U.S. economic data is due today, including the Non-Farm Payrolls report, the unemployment rate, and average hourly earnings. Elevated volatility is expected around the release.
Risk Warnings:
- Gold trading carries a relatively high level of risk and may not be suitable for all investors.
- Ongoing trade and geopolitical tensions continue to heighten uncertainty, keeping all scenarios possible.
Risk Disclaimer: Trading CFDs involves risks, and therefore all scenarios may be plausible. The content above is not a recommendation to sell or buy but rather an explanatory reading of price movement on the chart.
| S1: 5000.00 | R1: 5088.00 |
| S2: 4945.00 | R2: 5128.00 |
| S3: 4906.00 | R3: 5180.00 |