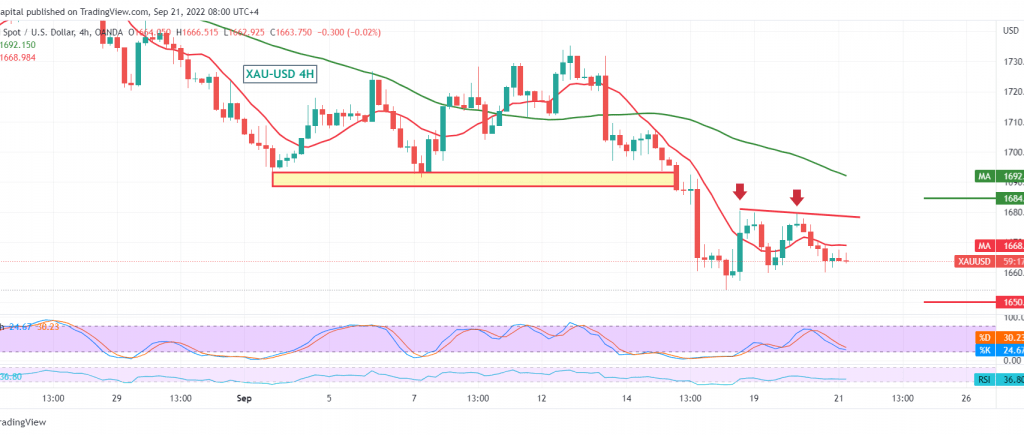
There, gold prices found a strong resistance level at 1680, as we mentioned during the last analysis, which forced gold to return to the downside path within the mentioned context, touching the first target of 1663, recording its lowest level at $1660 per ounce.
On the technical side, the simple moving averages still provide negative pressure on the price from above, which comes in conjunction with the clear negative signs on the momentum indicator.
From here and steadily intraday trading below 1675 and 1684, the bearish trend is most likely today, targeting 1656 first targets and then 1650 next stations. We must pay close attention that a decline below 1648 increases and accelerates the strength of the bearish trend, and we wait for an ounce of gold around 1642 and it may extend later towards 1637.
We remind you that activating the proposed scenario depends on the stability of daily trading below the extended resistance 1684/1680, and confirming its break invalidates the proposed scenario. We witness a clear recovery of gold prices to touch 1694 and 1703.
Note: We await the Fed statement and outlook, followed by a press conference. They have a significant impact, and we may witness high volatility in prices, which requires attention to the upcoming moves so that all scenarios are likely to occur.
Note: Trading on CFDs involves risks. Therefore, all scenarios may be possible. This article is not a recommendation to buy or sell but rather an explanatory reading of the price movement on the chart.
| S1: |
 Noor Trends News, Technical Analysis, Educational Tools and Recommendations

