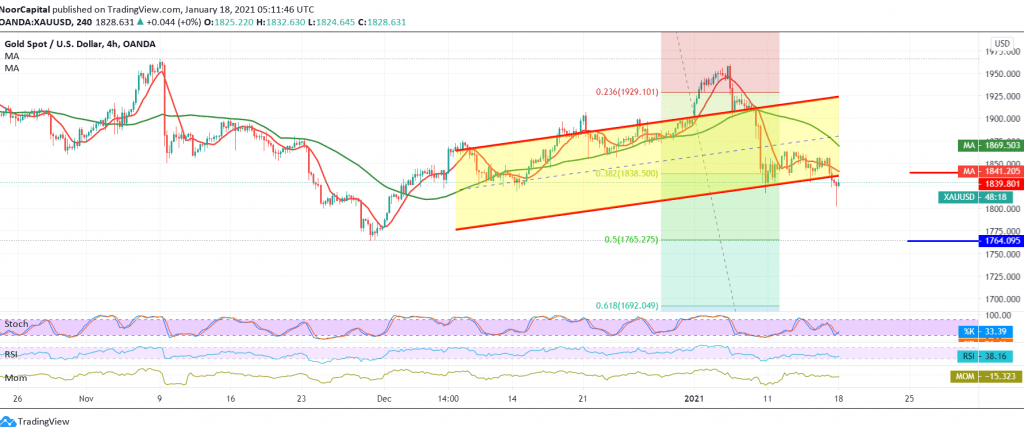
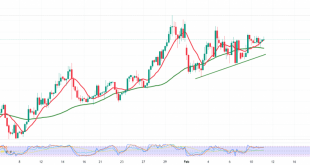
Gold prices started their first weekly trading with a noticeable decline after it failed to maintain trading levels above the support level of 1835, explaining that breaking the aforementioned level puts the price under negative pressure, its initial official target is around 1808, its lowest level during the Asian session for the current session 1802.
Technically, and with a closer look at the 240-minute chart, we find the RSI indicator started to gain bearish momentum, supported by the negative pressure coming from the 50-day moving average, which meets near 1856 and adds more strength to it.
The daily trend tends to the downside, knowing that confirming the break of 1802/1800 increases the selling flow to target 1775, and then 1765 Fibonacci 50.0%, a next official stop.
The activation of the suggested scenario depends on the intraday trading stability below 1838 and in general below 1856.
| S1: 1800.00 | R1: 1856.00 |
| S2: 1775.00 | R2: 1883.00 |
| S3: 1748.00 | R3: 1910.00 |
 Noor Trends News, Technical Analysis, Educational Tools and Recommendations

