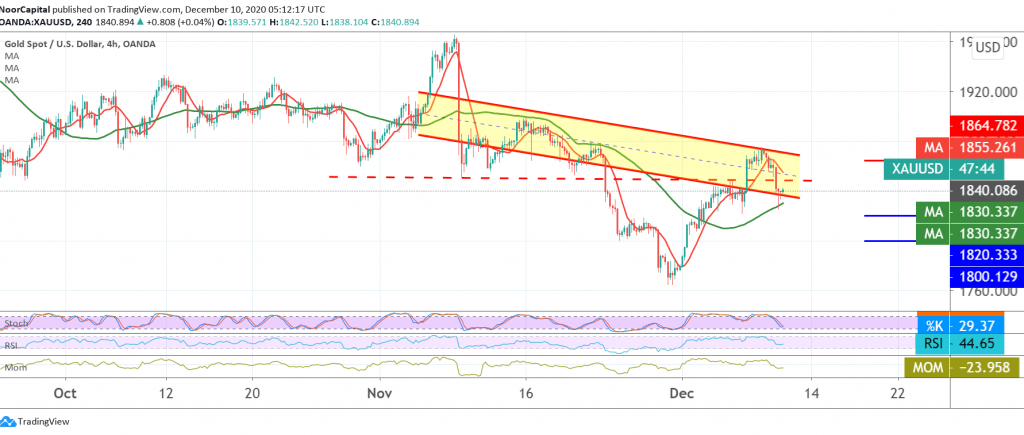
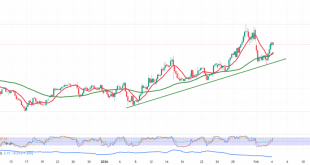
The pivotal resistance levels published during the previous analysis located at the price of 1870, which we indicated as the key to protecting the bearish trend, succeeded in limiting the upward bias, forcing gold prices again to trade negatively towards the second required target of 1843, posting its lowest price of 1825.
Technically speaking, with a closer look at the 240-minute chart the signs of negativity are still dominating the stochastic, and this comes in conjunction with the RSI gaining bearish momentum over the short time intervals.
From here, with the stability of the intraday trading below 1850 and most importantly 1865, this encourages us to maintain our negative expectations targeting 1820, bearing in mind that trading below the aforementioned level extends gold’s losses, opening the way directly towards re-testing the support level of the psychological barrier 1800.
From the top, surpassing the resistance level of 1865 negates the suggested bearish scenario and leads gold to a bullish path targeting 1870, and the gains will extend later towards 1883.
Note: The level of risk is high.
| S1: 1820.00 | R1: 1865.00 |
| S2: 1800.00 | R2: 1890.00 |
| S3: 1775.00 | R3: 1910.00 |
 Noor Trends News, Technical Analysis, Educational Tools and Recommendations

