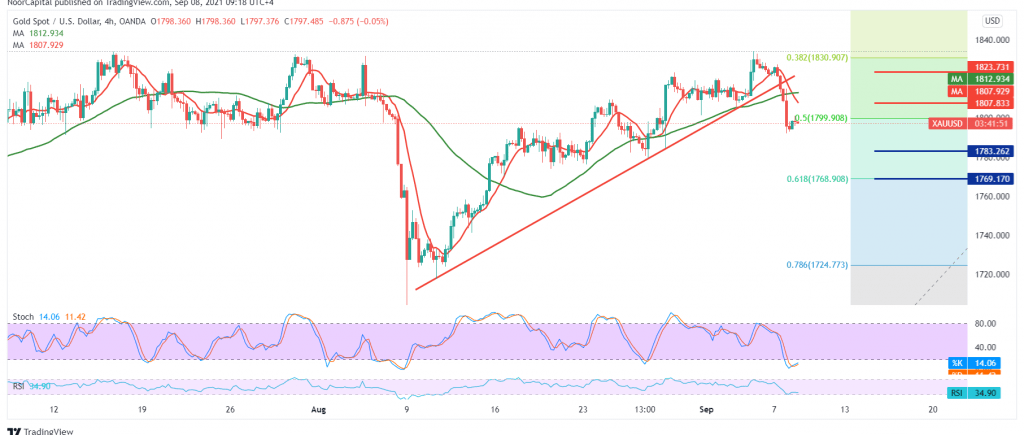
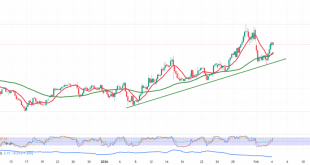
Gold prices declined noticeably during the last session after hitting the top level that was recently recorded around 1830 to retest the support floor 1799, which represents the key to protecting the bullish trend.
On the technical side, today, and by looking at the 240-minute chart, we find that the simple moving averages started their negative pressure on the price from above and the stability of the intraday trading below the 1819 resistance level.
On the other hand, we find gold now hovering around the 1799 level, the 50% Fibonacci correction, knowing that attempts to stabilize above the mentioned level may increase the possibility of a return to the rally.
Therefore, we prefer confirming the break of 1799, which facilitates the task required to visit 1784 first targets and then 1770 following official stations.
To remind that the continuation of the decline during today’s session requires trading to remain below 1799, and most notably 1719, and the breach of the latter will immediately stop the bearish bias and lead gold prices to touch 1823 initially. Note: the risk level may be high today.
| S1: 1784.00 | R1: 1819.00 |
| S2: 1770.00 | R2: 1840.00 |
| S3: 1749.00 | R3: 1854.00 |
 Noor Trends News, Technical Analysis, Educational Tools and Recommendations

