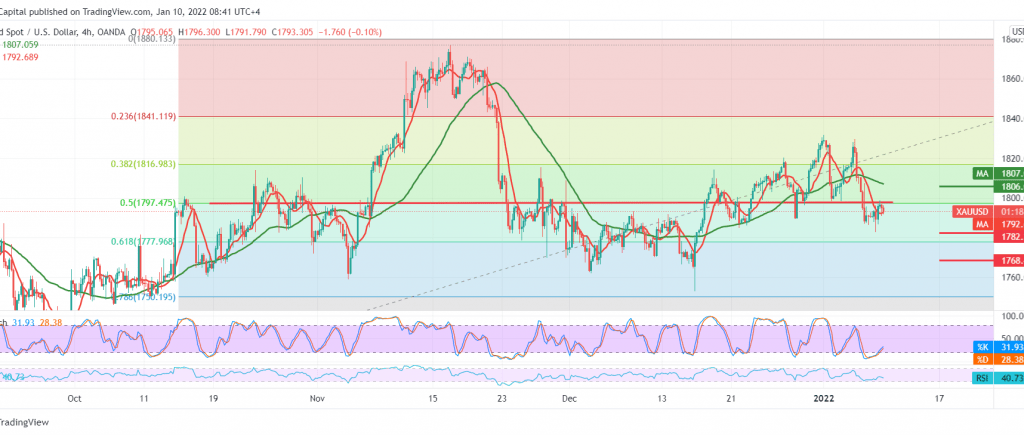
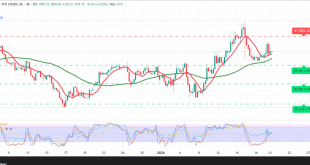
Gold prices succeeded in touching the first official target published during the last analysis at 1781, recording its lowest level at the end of last week’s trading of 1782.
On the technical side, gold’s current moves are witnessing stability below the previously broken support-into-resistance level 1797, 50.0% Fibonacci correction as shown on the chart, and the negative pressure coming from the simple moving averages.
Therefore, we may witness a negative trading session, knowing that trading below 1782 increases the possibility of a decline towards 1777 and 1774, respectively, considering that breaking the latter may open the way to retest the 1768 buying position.
Activating the suggested scenario depends on the stability of the intraday trading below 1798, and most notably 1806, knowing that the breach of the upside to the resistance level of 1806 can postpone the decline, and we may witness touching 1815 initially.
Note: the momentum indicator gives positive signals on the short time frames.
Note: CFD trading involves risks and therefore, all scenarios are on the table while waiting for a new signal
| S1: 1782.00 | R1: 1798.00 |
| S2: 1774.00 | R2: 1806.00 |
| S3: 1768.00 | R3: 1815.00 |
 Noor Trends News, Technical Analysis, Educational Tools and Recommendations

