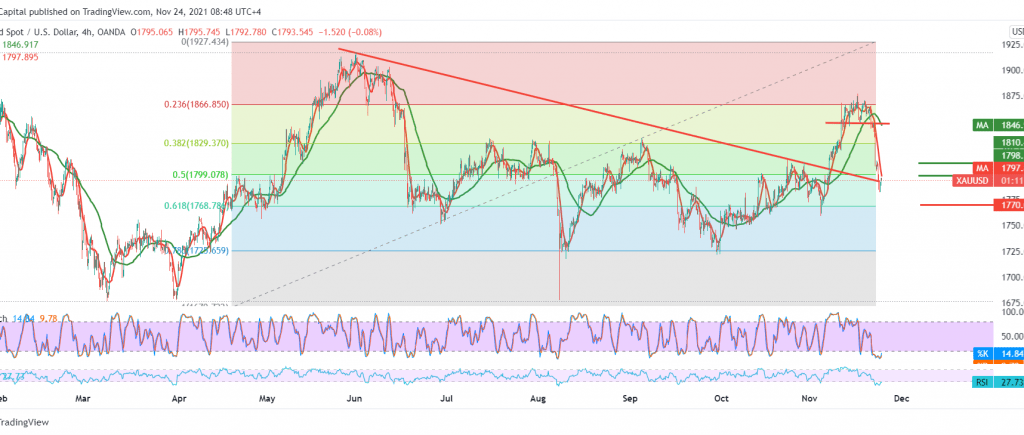
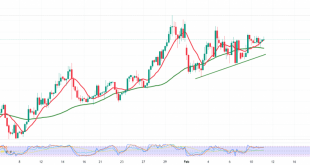
Gold prices continued the negative move within the strong profit-taking wave that started with the beginning of last week’s trading, explaining that the stability of trading below the 1799 support level, opening the door to visit the target of 1769, posting a low at 1781.
Technically, we notice the price stability below the strong demand area 1799 located at the 50.0% Fibonacci retracement as shown on the chart. The negative crossing of the simple moving averages still supports the bearish price curve.
Therefore, the daily bearish trend will remain the most preferred, and the price behavior of gold should be monitored around the 1781 level, because breaking it increases the pace of the decline to complete the current bearish wave to visit 1768, 61.80% correction, which represents a buying concentration point.
Note: the RSI is trying to get positive momentum signals on short intervals, pushing the price to retest 1810 before retracing.
Note: Today we are awaiting the Federal Reserve’s statement later in today’s session, and gold prices may witness high volatility.
| S1: 1779.00 | R1: 1810.00 |
| S2: 1765.00 | R2: 1825.00 |
| S3: 1749.00 | R3: 1840.00 |
 Noor Trends News, Technical Analysis, Educational Tools and Recommendations

