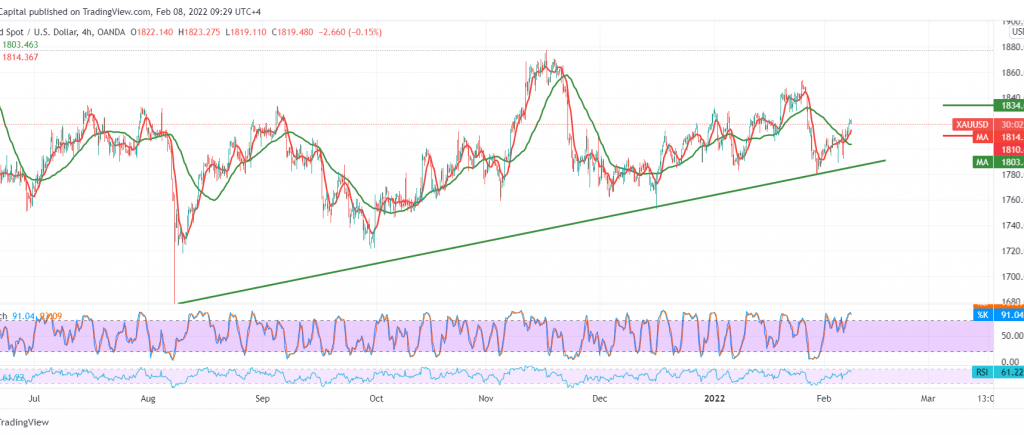
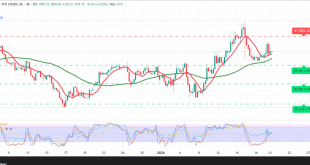
Gold prices jumped during the first trading of this week within the expected upward path during the previous analysis, heading to touch the first station 1819, approaching by a few points, at the second price station 1825, recording its highest level 1823.
On the technical side today, and by looking at the 4-hour chart, we notice the stability above 1810, accompanied by the 14-day momentum indicator getting positive signs, accompanied by the positive motive for the 50-day moving average.
The possibility of a bullish bias during today’s session is still valid, knowing that the breach of 1826 is a catalyst that enhances the chances of touching 1832 and may extend later towards 1840. The general trend is still bullish as long as trading is above the 1797 support line.
Note: Trading on CFDs involves risks. Therefore, all scenarios may be possible. This article is not a recommendation to buy or sell but rather an explanatory reading of the price movement on the chart.
| S1: 1810.00 | R1: 1826.00 |
| S2: 1797.00 | R2: 1832.00 |
| S3: 1783.00 | R3: 1842.00 |
 Noor Trends News, Technical Analysis, Educational Tools and Recommendations

