
Gold prices registered a notable decline at the start of this week’s trading session, driven largely by profit-taking activity, with the price reaching a low of $3,301 per ounce.
Technical Outlook:
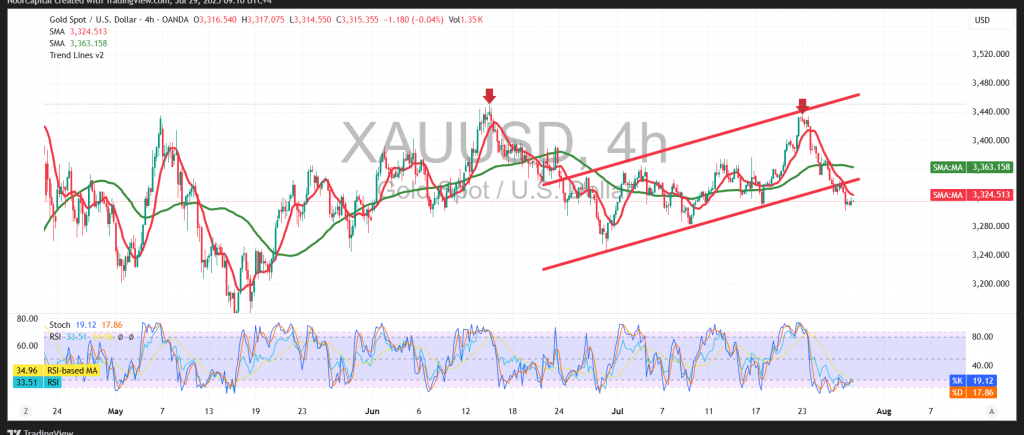
Intraday price action is showing a modest rebound as gold tests the key psychological support level at $3,300. This coincides with the emergence of early bullish signals on the Relative Strength Index (RSI), suggesting a potential pause in the selling pressure.
However, upward momentum remains weak, with prices still trading below the 50-period Simple Moving Average (SMA), which acts as a dynamic resistance currently positioned around $3,341.
Probable Scenario:
As long as the price remains below the $3,340 resistance level, the bias remains bearish. This is further supported by the recent breakdown below the ascending price channel, as seen on the chart, which favors continued downside movement.
A confirmed break below $3,296 would likely open the door for further declines, targeting the next support zone near $3,276.
Alternative Scenario:
Should the price manage to stabilize above $3,340, this may trigger a short-term corrective move, with potential upside towards the $3,364 level.
Warning: Market risks remain elevated amid persistent trade and geopolitical tensions. Traders should be prepared for heightened volatility and a wide range of possible outcomes.
Disclaimer: Trading in CFDs involves risks, and all scenarios are possible. This analysis is not investment advice but rather an interpretation of the current technical landscape for gold.
| S1: |