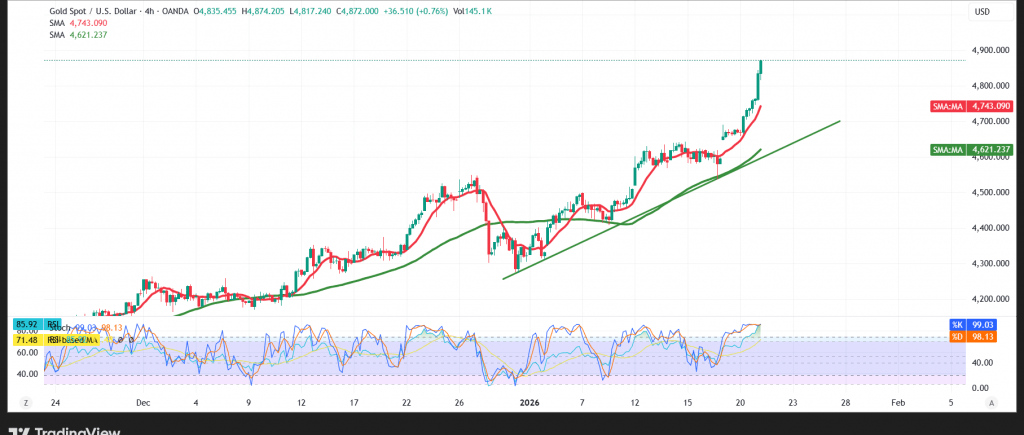
Gold prices (XAU/USD) staged an exceptional rally, surpassing all technical targets outlined in the previous report at $4,750. During early trading, the metal surged to a new all-time high near $4,877 per ounce, reflecting overwhelming buying pressure and strong bullish conviction.
Technical Outlook – 4-Hour Chart
Overall Trend Remains Bullish
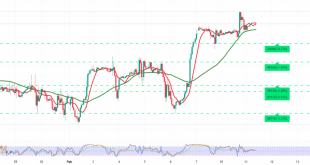
The broader structure for gold remains decisively bullish. Simple moving averages continue to provide dynamic support from below, preserving the integrity of the medium-term uptrend.
The Relative Strength Index (RSI) is delivering strong positive signals, despite operating in overbought territory. This behavior underscores the strength of the current momentum. Any short-term pullbacks or profit-taking attempts should be viewed within the context of this powerful trend and monitored closely.
A sustained break above the $4,870 level would confirm continued buying dominance, opening the door toward $4,937 as the next upside target, with scope for further gains toward the $5,010 region.
On the downside, a return to stability below $4,726 warrants caution. A confirmed break beneath this level could trigger a corrective phase, initially targeting the $4,587 area before the broader trend is reassessed.
Market Note:
Markets are awaiting statements from U.S. President Donald Trump today, which could trigger heightened volatility.
Risk Warnings:
- Gold trading currently carries a relatively high level of risk and may not be suitable for all investors.
- Ongoing trade and geopolitical tensions continue to elevate uncertainty, leaving all scenarios possible.
Risk Disclaimer: Trading CFDs involves risks, and therefore all scenarios may be plausible. The content above is not a recommendation to sell or buy but rather an explanatory reading of price movement on the chart.
| S1: 4726.00 | R1: 4937.00 |
| S2: 4587.00 | R2: 5010.00 |
| S3: 4515.00 | R3: 5148.00 |