
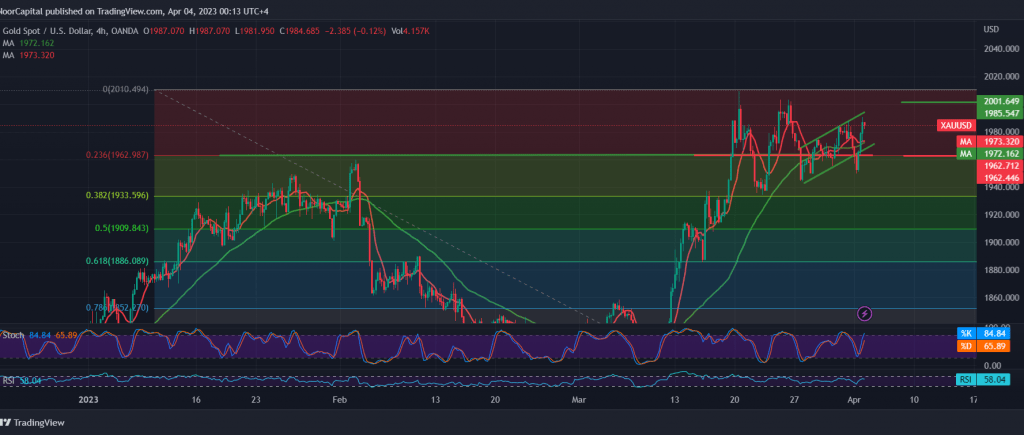
Gold prices failed to break the pivotal support floor published during the previous analysis at 1960, explaining that it represents the key to protecting the official bullish trend, returning to the bullish rebound towards 1990, to end its daily dealings above the support mentioned above.
Technically, the overall bullish trend is still the most likely, relying on the stability of trading above the previously breached resistance level to 1960 support level, which represents the key to protecting the bullish trend calculated by the continuation of the simple moving average providing a positive motive in addition to the bullish technical formation shown on the 4-hours chart.
Therefore, with stable trading above 1960, the bullish scenario remains the most preferred, knowing that the price’s consolidation above 1990 facilitates the task required to visit the psychological stimulus 2000. It is worth paying close attention that the closing of the 4-hour candlestick above 2000 increases and accelerates the strength of the overall bullish trend, initially paving the way towards 2020.
The break of 1960 leads gold prices to decline on an intraday basis, so we will be waiting for an ounce of gold around 1942, and then 1933, the correction of 38.20%, as shown on the chart above.
Note: the risk level is high, and the general trend needs more confirmation.
Note: Trading on CFDs involves risks. Therefore, all scenarios may be possible. This article is not a recommendation to buy or sell but rather an explanatory reading of the price movement on the chart.
| S1: |