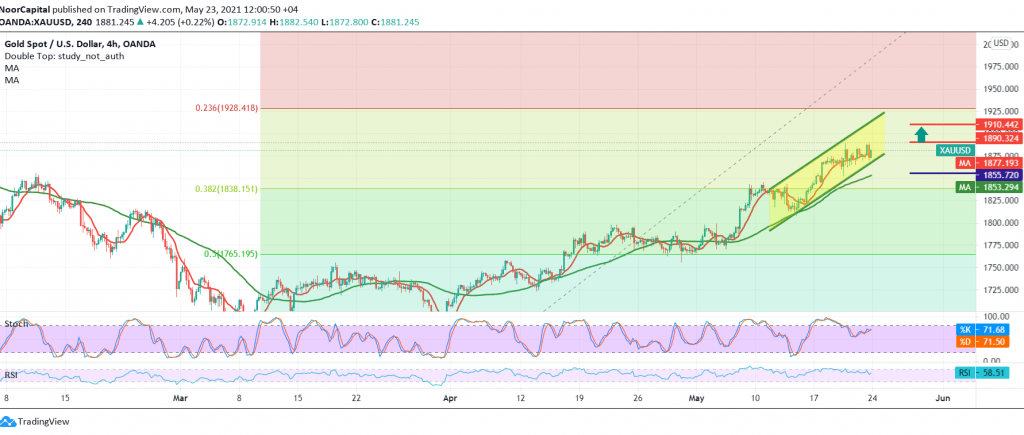
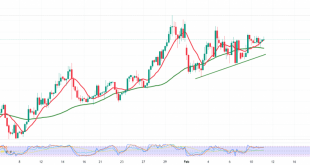
Gold prices managed to achieve the official bullish target published during the previous report, located at the price of 1890, to record its highest level at 1890.
On the technical side today, and by looking at the 4-hour chart, we find the price is stable above the support level of 1871, and the RSI indicator is still holding on to the bullish momentum on short time frames.
We tend to be positive in our trading, targeting 1890 as a first target, knowing that continuing to rise requires that we witness a clear and strong breach of the 1890 level, which increases and accelerates the strength of the daily bullish trend so that the way is directly open towards 1900 and the gains may extend later to 1910’s next official stop.
From below, trading below 1871 will halt the daily bullish trend, and will witness negative moves targeting a re-test of 1861 and then 1852, respectively. Note: Negative features appear on Stochastic.
| S1: 1871.00 | R1: 1890.00 |
| S2: 1861.00 | R2: 1899.00 |
| S3: 1852.00 | R3: 1910.00 |
 Noor Trends News, Technical Analysis, Educational Tools and Recommendations

