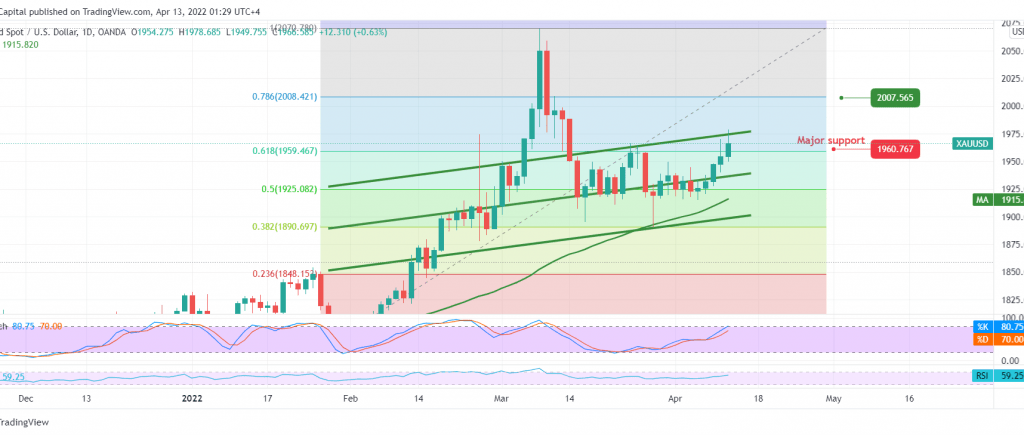
Gold prices jumped during the previous trading session after we stayed on the fence, explaining that we are waiting for a new signal to continue the upside and breach of 1960 increases and accelerate the strength of the bullish trend, targeting 1978 to record gold at its highest level at 1978.
Technically, looking at the 4-hour chart, we find the 50-day simple moving average that supports the bullish price curve, accompanied by the positive momentum indicator on the short time frames.
Therefore, with the intraday trading remaining above the previously breached resistance-into-support at 1960, 61.80% correction, and in general, stability above 1943, the bullish bias is the most likely, knowing that the consolidation above 1980 is a motivating factor that can enhance the chances of rising towards 1993 and then 2000 following official stations.
Trading below 1943 may put the price under temporary negative pressure targeting a retest of 1925, 50.0% Fibonacci retracement, as shown on the chart.
Note: Trading on CFDs involves risks. Therefore, all scenarios may be possible. This article is not a recommendation to buy or sell but rather an explanatory reading of the price movement on the chart.
| S1: |
 Noor Trends News, Technical Analysis, Educational Tools and Recommendations

