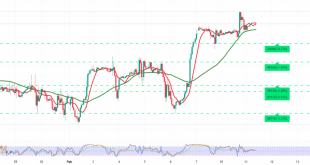
Gold prices managed to achieve the first target required to be touched during the previous analysis, located at 1754, to record its highest level, 1758.
Technically, and with a closer look at the 4-hour chart, we find the simple moving averages continue to hold the price from below, and the 50-day average meets around the 1740 support level and adds more strength to it.
Hence, we believe that there is a possibility of further upside movement during today’s session targeting 1765 Fibonacci 50.0% Fibonacci retracement, a next official leg.
The activation of the suggested bullish scenario depends on the stability of gold prices above 1740/1739, bearing in mind that breaking the aforementioned level delays the chances of an upside, but does not eliminate them, and we may witness a re-test of 1730 and 1723 before attempting to rise again.
| S1: 1739.00 | R1: 1765.00 |
| S2: 1723.00 | R2: 1773.00 |
| S3: 1714.00 | R3: 1790.00 |
 Noor Trends News, Technical Analysis, Educational Tools and Recommendations


