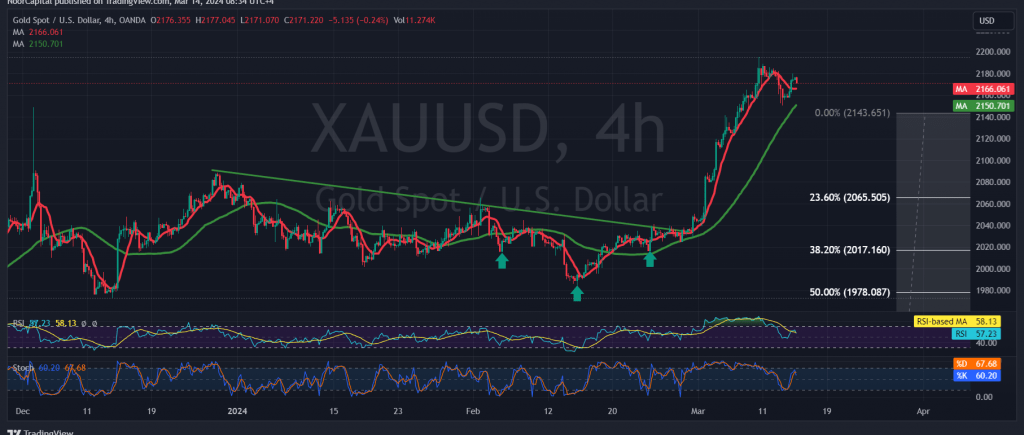
Gold prices have rebounded, resuming their official upward trajectory and negating the need for the retesting scenario outlined in the previous technical report. The metal settled with its lowest level recorded at $2157 per ounce.
Today’s technical analysis, focusing on the 4-hour timeframe chart, indicates continued support from the simple moving averages, complemented by positive signals from the 14-day momentum indicator.
Consequently, the prevailing outlook favors further upward movement, contingent upon a decisive breach of the extended resistance levels at 2181-2185. Such a breakthrough would pave the way for initial targets at 2192 and 2200, with potential extensions towards 2205.
However, it’s crucial to note that failure to consolidate above 2181, and more significantly, 2185, coupled with a return to trading stability below 2157, may prompt a retracement in gold prices. In such a scenario, the metal may seek to retest the main support at the current trading levels of 2144 before resuming its ascent.
Investors should exercise caution, particularly in light of anticipated high-impact economic data releases from the American economy today. Key indicators include core monthly and annual producer prices, producer prices, and retail sales, which may contribute to heightened price volatility.
Given the elevated risk level amidst ongoing geopolitical tensions, all potential scenarios remain plausible, underscoring the need for careful risk management strategies.
Note: Trading on CFDs involves risks. Therefore, all scenarios may be possible. This article is not a recommendation to buy or sell but rather an explanatory reading of the price movement on the chart
| S1: |
 Noor Trends News, Technical Analysis, Educational Tools and Recommendations

