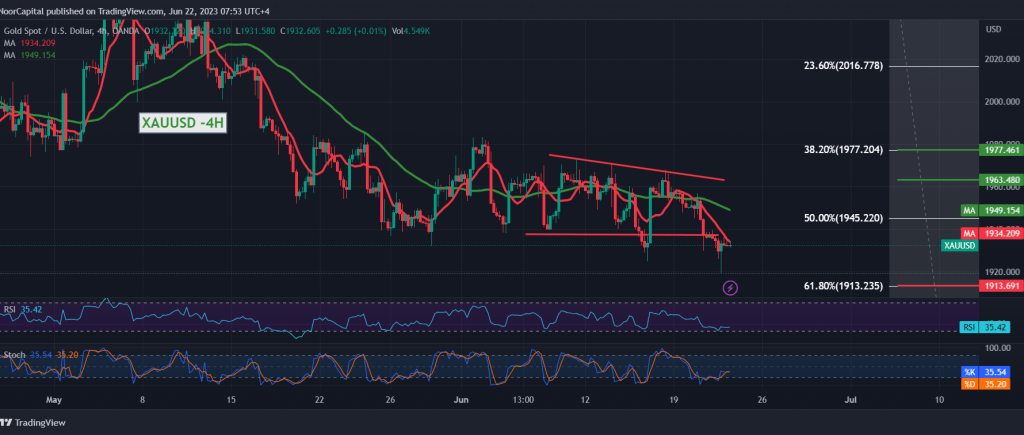
Gold prices succeeded in achieving the expected negative outlook during the previous technical report, explaining that the continuation of trading below the main support of 1945 constitutes a negative pressure factor, with a target of 1924 and a main target of 1913, to suffice for recording its lowest level yesterday at $1919 per ounce.
Technically, and by looking at the 4-hour chart, the current movements witness stability below the previously covered support, which was transformed into the 1945 resistance level, Fibonacci correction 50.0%, in addition to the negative pressure coming from the 50-day simple moving average, which meets near 1945 and adds to it—more strength, which stimulates the continuation of the bullish momentum’s confinement.
Therefore, we maintain our negative outlook, towards the official target of the current downward wave of 1913, Fibonacci correction 61.80%, and the price must be closely monitored around this level due to its importance to the general trend in the short term and breaking it extends the losses towards 1900 and 1897.
From above, price consolidation above 1961/1963 leads gold prices to retest 1970. In general, we continue to suggest the overall bearish trend as long as trading remains stable below the main resistance of the current trading levels of 1978 correction of 38.20%.
Note: Today we are awaiting high-impact economic data issued by the British economy, “the interest rate decision and monetary policy summary,” and from the United States, we await the testimony of the Federal Reserve Chairman “about the semi-annual monetary policy report before the House Financial Services Committee. We may witness a high price fluctuation during the news release.
Note: Trading on CFDs involves risks. Therefore, all scenarios may be possible. This article is not a recommendation to buy or sell but rather an explanatory reading of the price movement on the chart.
| S1: |
 Noor Trends News, Technical Analysis, Educational Tools and Recommendations

