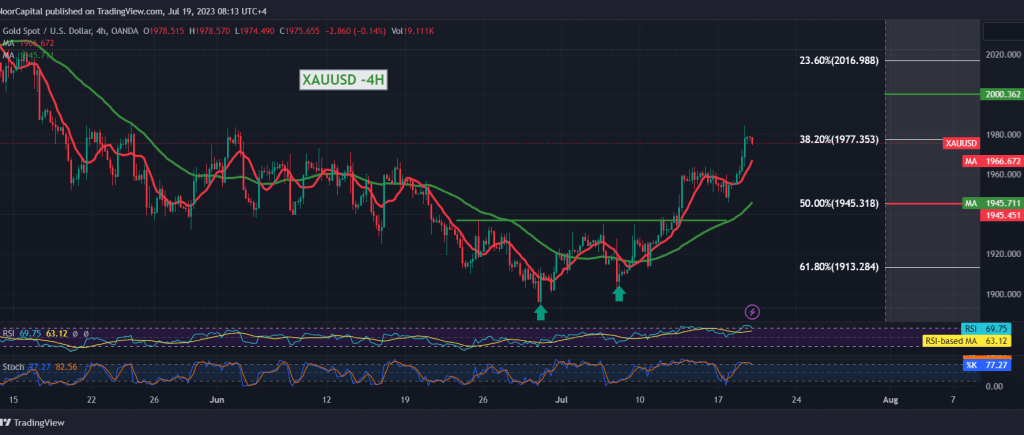
Gold prices maintained the bullish path within the positive outlook, as we expected, in which we relied on the success of gold prices in successfully retesting the main support level 1945, heading to touch the second target 1976, approaching by a few pips at the third stop 1988, recording its highest level at $1984 per ounce.
Technically, and by looking at the 240-minute chart, we find the price stable above the 50-day simple moving average, which meets around the 1945 level and adds more strength to it, and this comes in conjunction with gold continuing to gain positive momentum from the 14-day momentum indicator.
From here, with the stability of intraday trading above 1958, and in general above 1945, the bullish scenario remains the most likely during the session, knowing that the consolidation above 1984 facilitates the task required to visit 1988 as the next target. Its break increases and accelerates and confirms the strength of the bullish trend to be waiting for $2000, and the gains may extend later towards 20141.
Closing of at least an hourly candle below 1945 nullifies the activation of the suggested scenario. The offending trend returns to control gold’s movements, and we are witnessing a retest of 1935 and 1913 61.80% correction.
Note: Stochastic is negative and there is a possibility of some fluctuation until obtaining the required official trend.
Note: Today we are awaiting high-impact economic data issued by the US economy “Housing starts”, and we may witness high volatility at the time of the news release.
Note: Trading on CFDs involves risks. Therefore, all scenarios may be possible. This article is not a recommendation to buy or sell but rather an explanatory reading of the price movement on the chart.
| S1: |
 Noor Trends News, Technical Analysis, Educational Tools and Recommendations

