
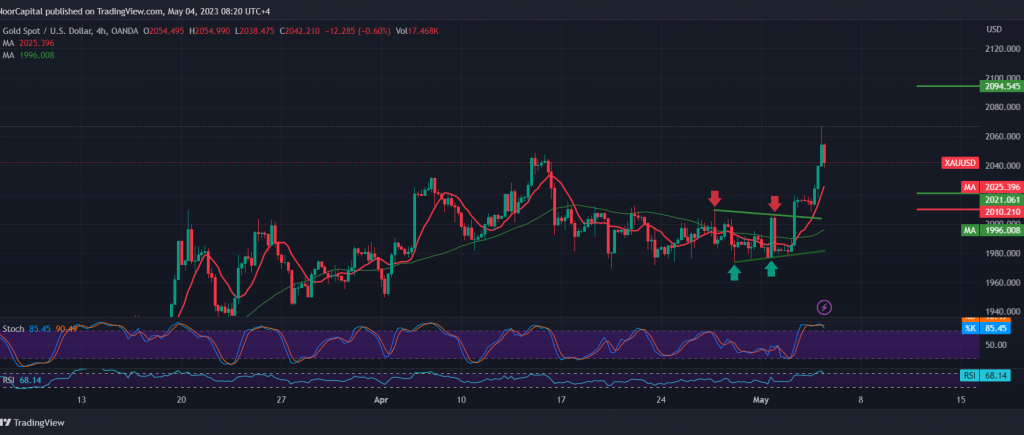
Gold prices continued their upward push within the expected bullish technical path mentioned in the previous analysis, in which we relied on the confirmation of gold prices breaching the resistance of the symmetrical triangle, as we explained yesterday, heading to touch the official target of the previous analysis 2045, recording its highest level at $2067 per ounce.
Technically, and by looking at the 4-hour chart, the price is stable intraday above the 2010 resistance level, accompanied by the continuation of obtaining a positive motive from the simple moving averages that continue to hold the price from below, in addition to the stability of the relative strength index above the mid-line 50.
The bullish trend is the most preferred during today’s session’s trading. Still, with careful consideration, we find the stochastic indicator around the overbought areas. We may witness some fluctuation until the official trend is obtained, pushing gold to provide some bearish tendency to re-test 2010 before resuming the rise again, knowing that the trend is bullish. Its goals are 2070. Its break will lead gold to continue its strong rise towards 2098.
Closing an hourly candle below 2010 may lead the price towards 1980.
Note: The level of risk may be high today, and all scenarios are likely to occur, and careful consideration is required, noting that the current trading levels may not match the risk rate compared to the expected returns.
Note: Today, we are awaiting high-impact data issued by the euro area, “interest rates, the European Central Bank’smonetary policy statement and the European Central Bank’spress press conference,” and we may witness high price volatility at the time of the news release.
Note: Trading on CFDs involves risks. Therefore, all scenarios may be possible. This article is not a recommendation to buy or sell but rather an explanatory reading of the price movement on the chart.
| S1: |