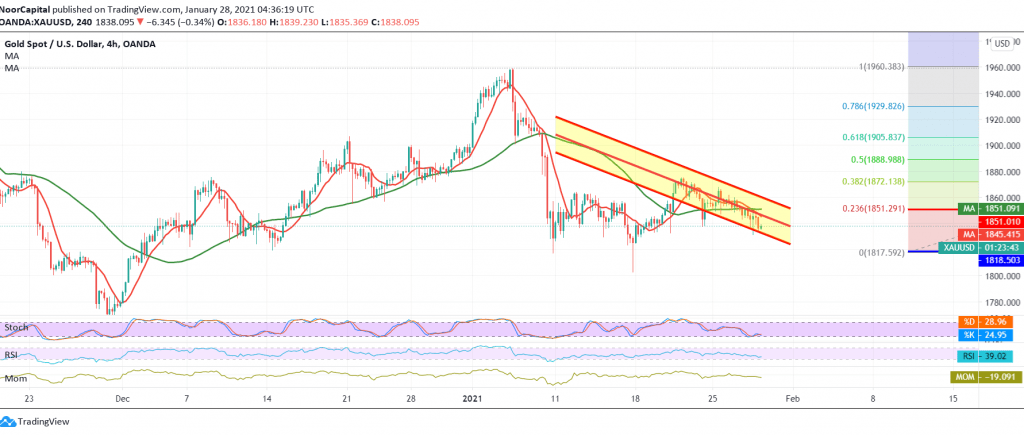
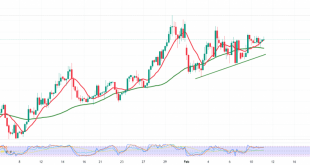
Gold prices succeeded in achieving the expected negative outlook during the last analysis, located at the price of 1838, to record its lowest price during the previous session in 1831.
On the technical side, and by looking at the chart at a 240-minute chart, we notice that the price continues to get negative pressure from the simple moving averages, accompanied by the continuation of the RSI’s defence of the bearish trend on short time frames.
Consequently, we will maintain our negative outlook, towards the second target of the previous analysis, 1828 and then 1818, bearing in mind that breaking the last leads the price to enter a strong bearish wave, whose official target is around 1800.
From the top, to break to the upside and rise above 1851, Fibonacci retracement 23.60% delays the bullish chances but does not cancel it, and we witness a re-test of 1862 before declining again.
| S1: 1828.00 | R1: 1850.00 |
| S2: 1818.00 | R2: 1862.00 |
| S3: 1806.00 | R3: 1872.00 |
 Noor Trends News, Technical Analysis, Educational Tools and Recommendations

