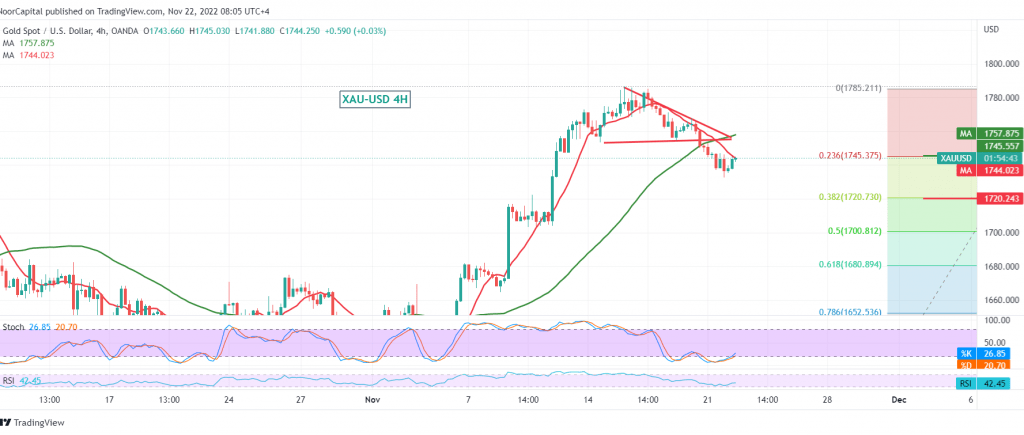
Gold prices achieved the corrective decline idea published during the previous technical report, touching the first official target of the bearish correction wave at 1734, recording its lowest level in the last session, trading at $1732 per ounce.
Technically, and by looking closely at the 240-minute chart, we find a bearish technical formation that supports the bearish daily direction, in addition to the continuation of the simple moving averages exerting their negative pressure on the price from above.
Therefore, the bearish correction remains valid and effective towards the official target 1720/1722, correction of 38.20%, an official expected station, unless we witness the price consolidation again above 1755, and most importantly 1760. Consolidation above 1760 leads gold prices to visit 1775 again initially.
Note: Stochastic is trying to get positive crossover signals on short time intervals.
Note: Trading on CFDs involves risks. Therefore, all scenarios may be possible. This article is not a recommendation to buy or sell but rather an explanatory reading of the price movement on the chart.
| S1: |
 Noor Trends News, Technical Analysis, Educational Tools and Recommendations

