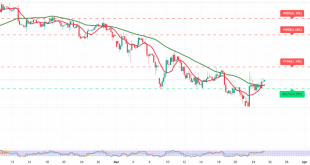
Gold prices maintain the gradual bullish tendency after it succeeded in breaching the resistance level of 1810, recording its highest level during the previous trading session of 1829.
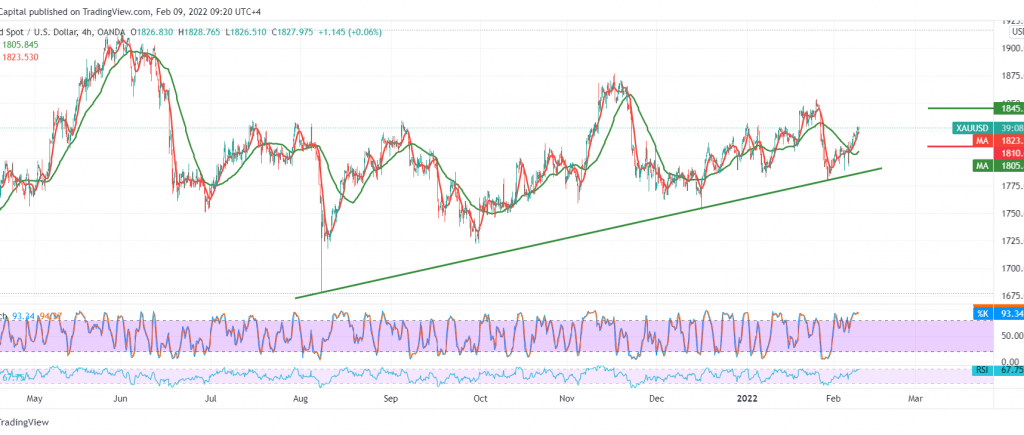
Technically and by carefully looking at the 4-hour chart, we notice that the moving average supports the bullish price curve. In addition, we find that the 14-day momentum indicator is still getting positive signs by moving to shorter time intervals.
Intraday trading above 1818 and 1815 may support resuming the upside to visit the areas of 1831 and 1836 respectively, knowing that the price’s consolidation above the last level may constitute a positive incentive that contributes to visiting the next 1844 price stations as long as the price is intraday stable above the 1815 level.
The bullish trend is still intact unless we witness any movements below the pivotal support floor 1797.
Note: Trading on CFDs involves risks. Therefore, all scenarios may be possible. This article is not a recommendation to buy or sell but rather an explanatory reading of the price movement on the chart.
| S1: 1818.00 | R1: 1831.00 |
| S2: 1810.00 | R2: 1836.00 |
| S3: 1797.00 | R3: 1844.00 |