
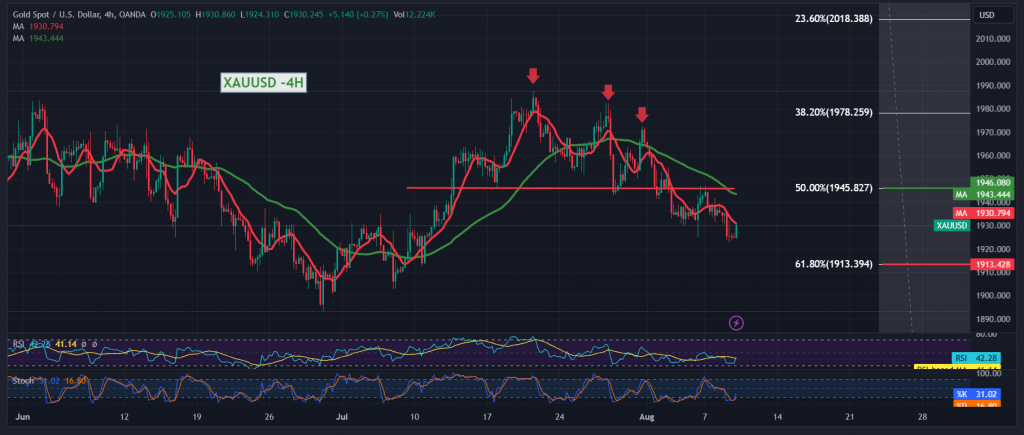
Gold prices were able to achieve the first bearish target required to be touched during the previous trading session, located at 1926 price, recording its lowest level at $1922 per ounce.
Today’s technical vision indicates the possibility of resuming the bearish trend, relying on the continuation of the negative impact of the bearish technical structure as shown on the 240-minute chart, in addition to the negative pressure coming from the simple moving averages that support the daily bearish price curve.
From here, with trading stability below 1945 correction 50.0%, the bearish scenario remains the most likely during the session, knowing that consolidation below 1926 facilitates the task required to visit 1913 Fibonacci correction 61.80% as the main expected target.
To remind you that closing at least an hourly candlestick above 1945 nullifies the activation of the suggested scenario, and the bullish trend returns to controlling gold’s movements, and we are witnessing a re-test of 1956 in principle.
Note: Trading on CFDs involves risks. Therefore, all scenarios may be possible. This article is not a recommendation to buy or sell but rather an explanatory reading of the price movement on the chart.
| S1: |