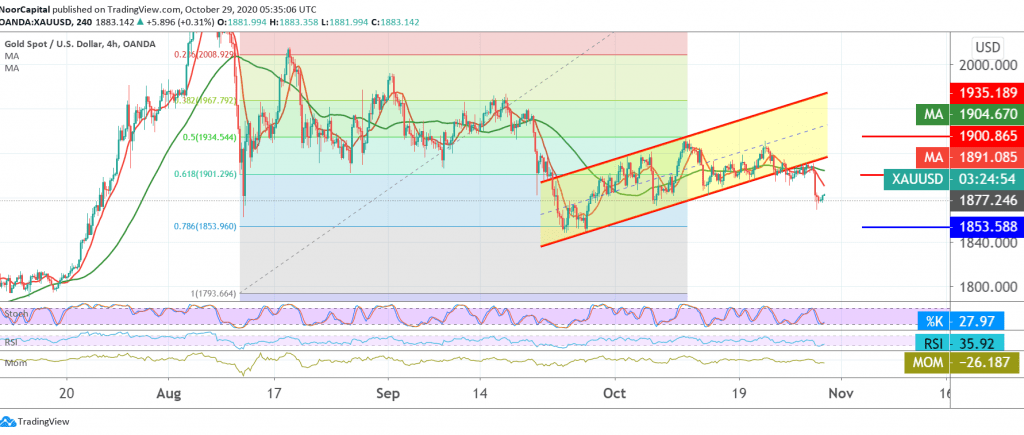
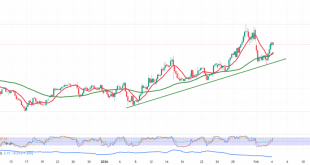
The yellow metal remained negatively trading in the previous trading session within the expected bearish path, touching the bearish targets published in the previous analysis at 1885, recording a low at 1869.
Technically, gold has succeeded in confirming a break of the pivotal support turned into resistance at 1901, Fibonacci 61.80%, and that is one of the main factors that encourage us to keep our negative outlook.
Looking at the chart, we find that the SMA continues to pressure the price. From here, intraday trading remains below 1891 and in general below 1901, the bearish scenario will remain intact, bearing in mind that the breakout of the base posted yesterday extends gold’s losses directly towards 1860/1864 and then 1845.
Crossing above 1901 will negate the bearish scenario and lead the price attempts to rise with the aim of 1928, then 1934, Fibonacci 50.0%.
| S1: 1864.00 | R1: 1901.00 |
| S2: 1845.00 | R2: 1928.00 |
| S3: 1823.00 | R3: 1946.00 |
 Noor Trends News, Technical Analysis, Educational Tools and Recommendations

