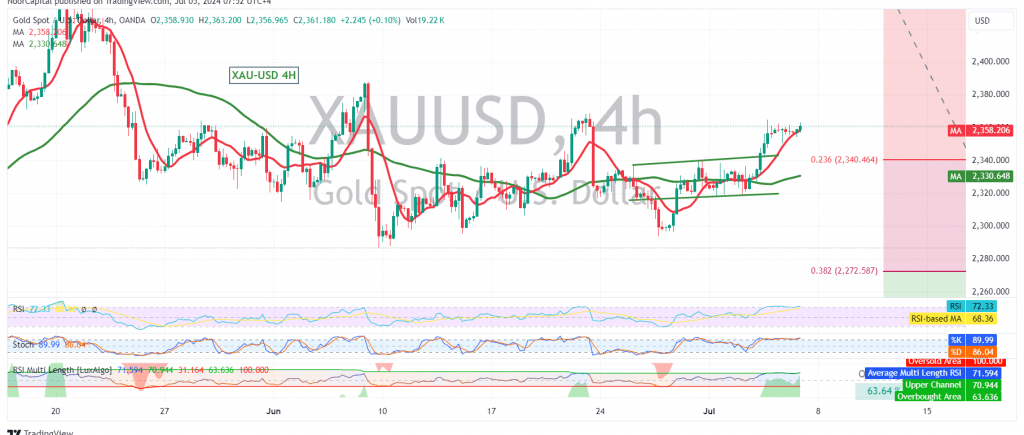
Gold prices have broken out of the previous sideways range, consolidating above the 2340 resistance level (23.60% Fibonacci retracement) as anticipated in our previous analysis. This breakout signals a potential shift in momentum towards a bullish trend.
Technical Outlook:
On the 4-hour chart, the price is now trading above the 2340 resistance level, which has now turned into a support level. The simple moving averages (SMAs) are providing positive momentum, further supporting the bullish outlook.
Upward Potential:
With the breakout confirmed and the price holding above 2340, and more importantly 2336, the upward trend is likely to continue. The initial target is 2364. A break above this level could accelerate the rally towards 2374 and 2388, with the potential for further gains towards 2400.
Downside Risks:
However, traders should remain cautious as a return of trading stability below 2340 could invalidate the bullish scenario. This could trigger a downward correction, initially targeting 2318 and potentially extending towards 2297 if the 2318 support is breached.
Key Levels:
- Support: 2340 (23.60% Fibonacci retracement), 2336, 2318, 2297
- Resistance: 2364, 2374, 2388, 2400
Important Note:
The release of high-impact U.S. economic data today, including non-farm payrolls, unemployment rate, and average hourly earnings, could induce significant price volatility. Traders should closely monitor the market’s reaction to these data releases.
Disclaimer: Trading in CFDs involves risks, and all scenarios are possible. This analysis is not investment advice but rather an interpretation of the current technical landscape for gold.
| S1: |
 Noor Trends News, Technical Analysis, Educational Tools and Recommendations

