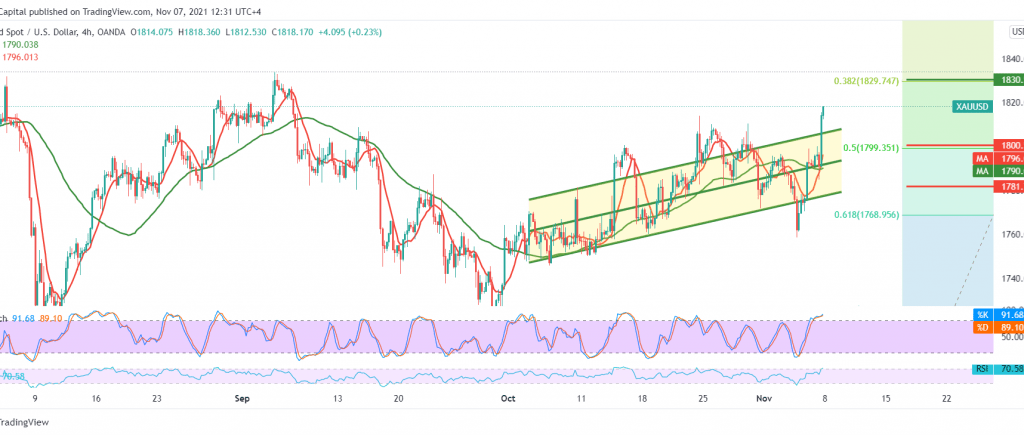
We adhered to intraday neutrality during the previous report, due to the conflicting technical signals, to notice the bullish rush witnessed by the yellow metal at the end of last week’s trading, and to remind us that to confirm these buying positions, it requires breaching 1799 to target 1816 to touch goal of 1818.
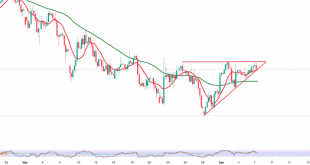
Technically, by looking at the 4-hour chart, we notice that gold obtained a positive stimulus from the 50-day simple moving average. We find the price succeeded in stabilizing positively above the previously breached resistance-into-support at 1799, 50.0% Fibonacci correction, as well. The RSI is stable above the mid-line 50, which are technical factors that increase the possibility of continuing the rise to visit 1830, Fibonacci correction of 38.20%, the first ascending target.
Stochastic is trading around overbought areas and may lose gradual momentum, which may indicate the possibility of a bearish bias before rising again, knowing that if a bearish slope occurs during the session, its target may be around 1799, and the bearish correction may extend towards 1784.
Note: All scenarios are available.
| S1: 1796.00 | R1: 1830.00 |
| S2: 1774.00 | R2: 1840.00 |
| S3: 1763.00 | R3: 1862.00 |