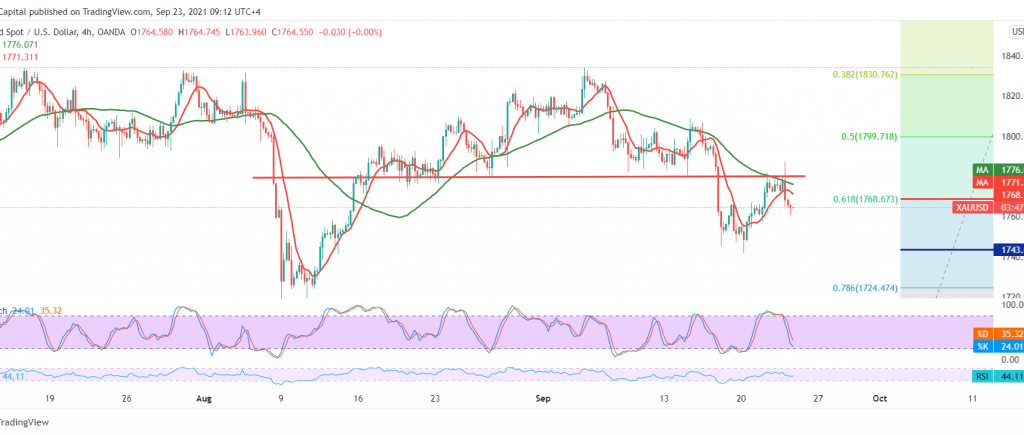
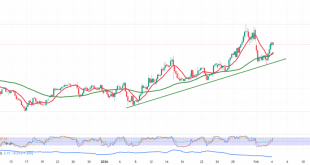
Gold’s movements witnessed random trades affected by the Federal Reserve’s decisions yesterday, with total bearish performance, to witness intraday stability below 1774, and in general, below 1780.
On the technical side today, looking at the 240-minute chart, we notice the negative impact of the bearish technical structure shown on the chart that supports the negativity and the RSI gaining a clear, strong bearish momentum on the short time frames.
From here and steadily trading below the previously broken support and transferred to the 1768 resistance level represented by the 61.80% Fibonacci correction, and in general below 1774; therefore, the bearish scenario remains valid and effective, targeting 1753 and 1743 expected targets, taking into consideration that the official target of the current downside wave lies around 1735.
| S1: 1753.00 | R1: 1780.00 |
| S2: 1743.00 | R2: 1799.00 |
| S3: 1726.00 | R3: 1807.00 |
 Noor Trends News, Technical Analysis, Educational Tools and Recommendations

