
Gold prices experienced significant losses in the previous trading session, reflecting the anticipated upward trend. However, the rise of the US dollar following inflation data spurred a downward trend, with gold bearing the brunt.
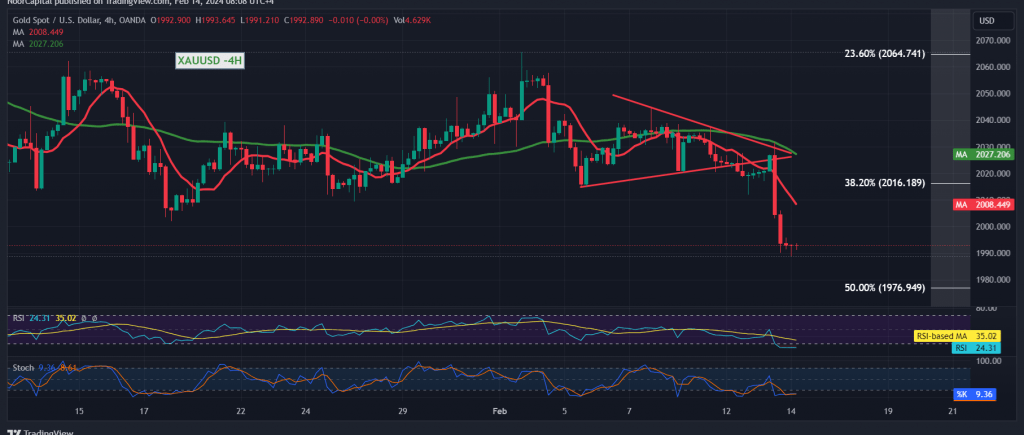
From a technical standpoint, previous reports this month highlighted the importance of maintaining trading above the pivotal support level for 2016. However, gold breached this level, initiating a bearish correction wave with initial targets set at 1995, reaching a low of 1988. The 4-hour chart indicates a clear break of the 2016 support level, now acting as resistance, with simple moving averages forming a negative crossover, supporting the continuation of the downward trend.
Thus, the likelihood of further decline remains high, with the next official target set at 1977, the 50.0% correction level, before determining subsequent price destinations.
It’s important to note that a return to stability above 2016 could disrupt the downward correction and prompt gold to resume recovery attempts, potentially retesting 2035.
Warning:
The Stochastic indicator suggests oversold conditions, adding a note of caution amidst the downward trend. Traders should remain vigilant and adapt their strategies accordingly.
Note: Trading on CFDs involves risks. Therefore, all scenarios may be possible. This article is not a recommendation to buy or sell but rather an explanatory reading of the price movement on the chart
| S1: |