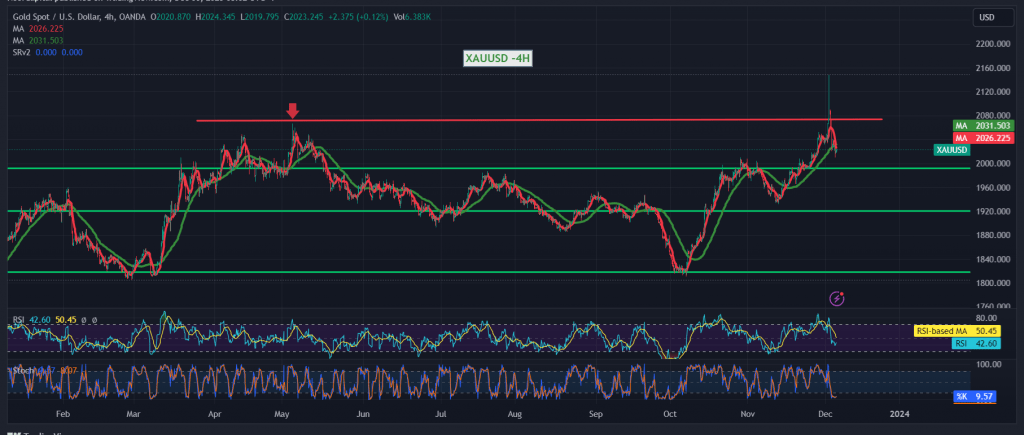
In the latest trading session, gold experienced a predominant negative trend, aligning with the anticipated bearish outlook and reaching its lowest point at $2009 per ounce. A closer technical analysis reveals ongoing downward pressure, with simple moving averages crossing negatively on the 4-period chart and concurrent negative signals emerging on the Stochastic indicator. Notably, the price attempted to find support at the $2009 level.
In our trading approach, a cautious negativity is maintained, targeting $2007 and subsequently $2000 as the initial waypoints. A pivotal focus is on the psychological barrier at $2000, as a confirmed breach could intensify negative pressure, setting a target at $1992.
However, it’s essential to remain vigilant, as an upward crossover and sustained consolidation above $2040, confirmed by at least an hourly candle, could interrupt the downward trajectory. In such a scenario, we anticipate gold to retest $2056 and potentially reach $2073.
Investors are urged to exercise caution given the high-risk level, where unexpected movements may deviate from projected returns. Additionally, today’s market dynamics are influenced by high-impact economic data from the American economy, specifically the “change in private non-agricultural sector jobs” from Canada. The interest statement and rate decision from the Bank of Canada, coupled with the press talk by the Governor of the Bank of England, are expected to contribute to heightened price fluctuations.
Moreover, geopolitical tensions persist, further elevating the risk level and potential for increased price volatility. Traders are advised to stay informed, exercise caution, and remain adaptable to changing market conditions amid these uncertain circumstances.
Note: Trading on CFDs involves risks. Therefore, all scenarios may be possible. This article is not a recommendation to buy or sell but rather an explanatory reading of the price movement on the chart.
| S1: |
 Noor Trends News, Technical Analysis, Educational Tools and Recommendations

