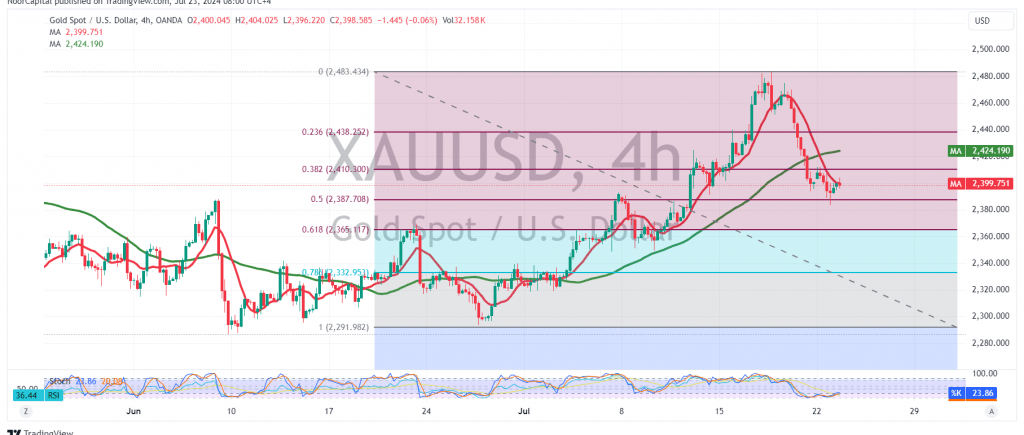
Gold prices have experienced a downward trend, retreating from the recent historical peak of $2483. The technical outlook suggests a continuation of this corrective movement.
Technical Outlook:
On the 4-hour chart, the simple moving averages (SMAs) have formed a negative crossover, indicating increased selling pressure. Moreover, the price remains below the strong resistance level of 2410, which coincides with the 38.20% Fibonacci retracement level. These factors point towards a bearish bias.
Downside Potential:
We anticipate a further decline in gold prices, with a break below 2383 likely to accelerate the downward momentum. The first target for this corrective wave is 2365, the 61.80% Fibonacci retracement level, followed by a potential extension towards 2333.
Potential Reversal:
However, a close above the 2410 resistance level on the hourly chart could signal a temporary pause in the decline and potential recovery attempts, targeting 2424 and 2442.
Key Levels:
- Resistance: 2410 (38.20% Fibonacci retracement), 2424, 2442
- Support: 2383, 2365 (61.80% Fibonacci retracement), 2333
Important Note:
The ongoing geopolitical tensions continue to contribute to heightened risk levels in the gold market, potentially leading to significant price volatility. Traders should exercise caution and closely monitor market developments.
Disclaimer: Trading in CFDs involves risks, and all scenarios are possible. This analysis is not investment advice but rather an interpretation of the current technical landscape for gold.
| S1: |
 Noor Trends News, Technical Analysis, Educational Tools and Recommendations

