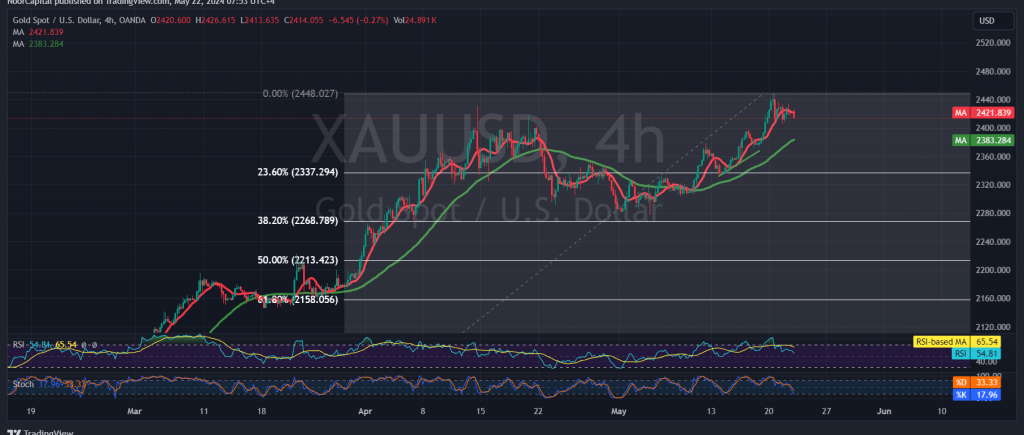
In the previous trading session, gold prices exhibited a bearish tendency, stabilizing below the main resistance level at $2430 per ounce and reaching a low of $2406.
Technical Analysis
Examining the 4-hour chart reveals the following:
- Resistance Levels: Price remains stable below the $2430 resistance.
- Stochastic Indicator: Showing a gradual loss of upward momentum, indicating potential for further decline.
Downward Correction
The potential for a corrective decline remains strong, with key targets identified as follows:
- First Target: $2400. A break below this level could intensify the downward movement.
- Subsequent Targets: $2375 and $2354.
- Main Target: $2337, corresponding to the 23.60% Fibonacci retracement level.
Upside Potential
Conversely, if gold prices manage to cross and consolidate above $2430, and more importantly the last peak at $2450, this could halt the bearish momentum. In such a scenario, new peaks could be targeted at $2485 and $2500.
Market Volatility Alert
Today, we expect significant market fluctuations due to the release of highly influential economic data from the United States, particularly the results of the Federal Reserve Committee meeting. Additionally, ongoing geopolitical tensions contribute to a high-risk environment, potentially leading to pronounced price volatility
Note: Trading on CFDs involves risks. Therefore, all scenarios may be possible. This article is not a recommendation to buy or sell but rather an explanatory reading of the price movement on the chart
| S1: |
 Noor Trends News, Technical Analysis, Educational Tools and Recommendations

