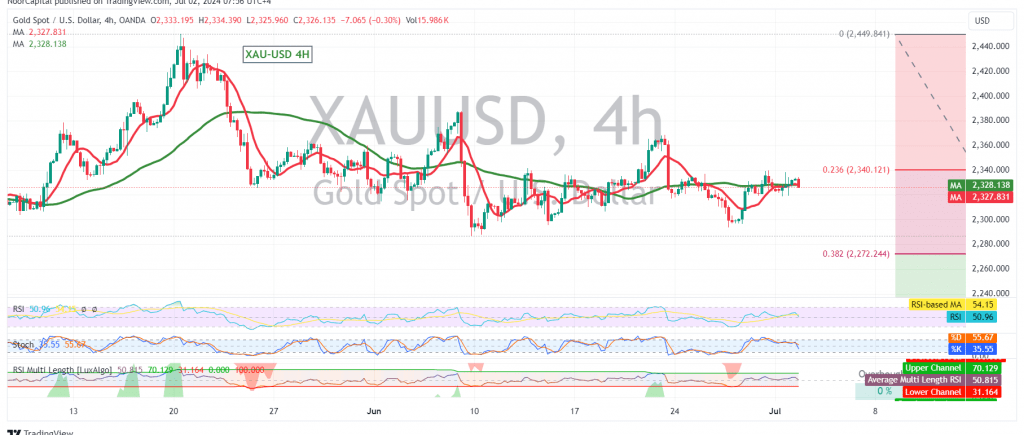
Gold prices continue to trade within a tight range, bounded by the 2318 support level and the 2340 resistance level.
Technical Outlook:
The technical outlook remains bearish, as the price continues to trade below the crucial 2340 resistance level (23.60% Fibonacci retracement) on the 240-minute chart. The 50-day simple moving average (SMA) is also acting as a dynamic resistance, reinforcing the downward pressure.
Downward Potential:
A break below the 2317 support level would likely trigger a resumption of the downward correction, with potential targets at 2300 and 2297. The primary target for this bearish wave remains at 2272.
Potential Reversal:
Traders should be aware that a sustained break and consolidation above the 2340 resistance level could invalidate the bearish scenario. In this case, a potential recovery towards 2348 and even 2357 could be expected.
Key Levels:
- Resistance: 2340 (23.60% Fibonacci retracement), 2348, 2357
- Support: 2317, 2300, 2297, 2272
Important Note:
The release of high-impact U.S. economic data today, including job vacancies and labor turnover rate, along with a speech by the Federal Reserve Chairman, could significantly impact gold prices. Traders should exercise caution and closely monitor the market’s reaction to these announcements.
Disclaimer: Trading in CFDs involves risks, and all scenarios are possible. This analysis is not investment advice but rather an interpretation of the current technical landscape for gold.
| S1: |
 Noor Trends News, Technical Analysis, Educational Tools and Recommendations

