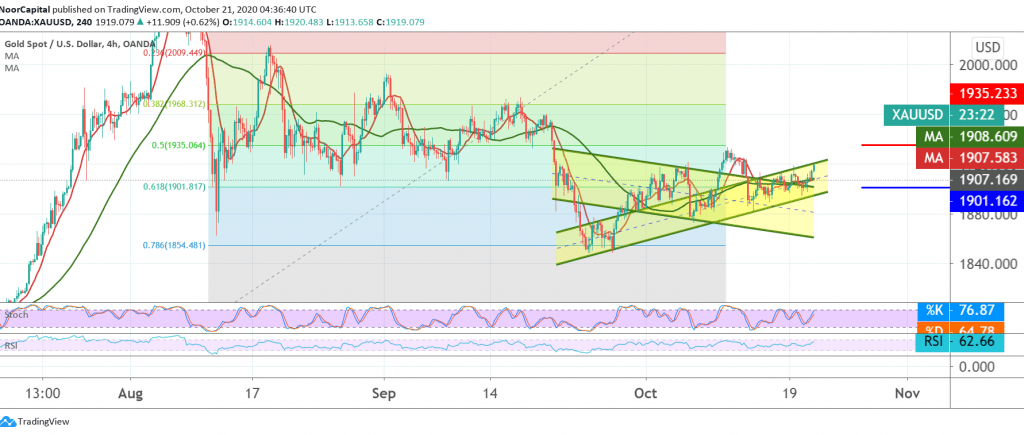
We remained neutral during the previous analysis and made it clear that we are waiting for a stronger direction to be determined after the technical signals contradicted, we have indicated that activating long positions needs a clear breakout of the 1913 resistance level. The yellow metal hit a high during the Asian session at 1920.
Technically, looking at the 240 minutes chart, we find that gold prices succeeded in building on a pivotal support floor of 1901, Fibonacci retracement of 61.80%, in addition to the continuation of obtaining a positive motive from the 50-day moving average that meets around 1901 and adds more strength.
By maintaining intraday trading above 1907 and the most important, 1901, the bullish bias will be likely today towards the second target of 1927, and breaking it will pave the way towards targeting 1934, Fib 50.0%.
Warning: the price behavior must be carefully monitored in the 1901-1934 price range.
| S1: 1901.00 | R1: 1927.00 |
| S2: 1884.00 | R2: 1934.00 |
| S3: 1875.00 | R3: 1956.00 |