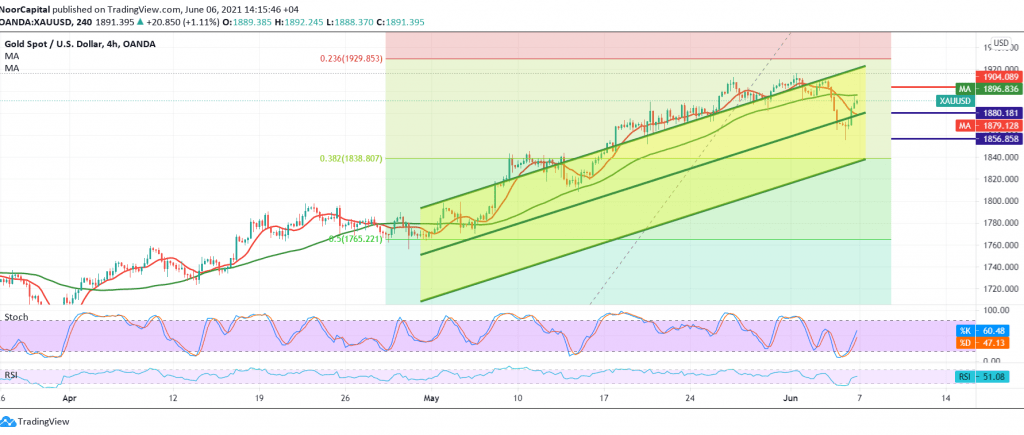
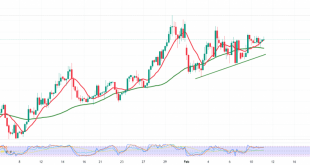
Gold prices succeeded in touching the official target published during the previous analysis, at 1856, recording a low on Friday at 1856.
On the technical side, gold succeeded in forming a good support floor around 1856, which forced it to rebound upwards again, approaching retesting the previously broken support 1895.
Upon closer examination of the chart, we find the 50-day moving average that is still an obstacle to the occurrence of more rise, and converges around 1895/1897, adding more strength to it.
On the other hand, the stability of trading above the support level of 1880 supports the return of the rise. We find it perplexed in determining the daily trend, and therefore in order to preserve the profitability rates that were achieved during the past week, we will stand on the sidelines to be in front of one of the following scenarios:
Activating the selling positions requires price stability below 1900, and most importantly 1905, in addition to confirming the break of 1880, and this facilitates the task required to visit 1856 and then 1856, respectively.
Activating long positions depends on the breach of 1905, which enhances the chances of a rise towards 1921/1925.
| S1: 1865.00 | R1: 1905.00 |
| S2: 1841.00 | R2: 1921.00 |
| S3: 1826.00 | R3: 1946.00 |
 Noor Trends News, Technical Analysis, Educational Tools and Recommendations

