Gold’s movements witnessed a bullish tendency during the last trading session within the attempts that aimed to retest the main resistance level at 1768. However, the price is still seeing stability below the mentioned level.
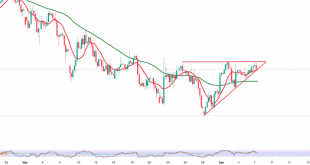
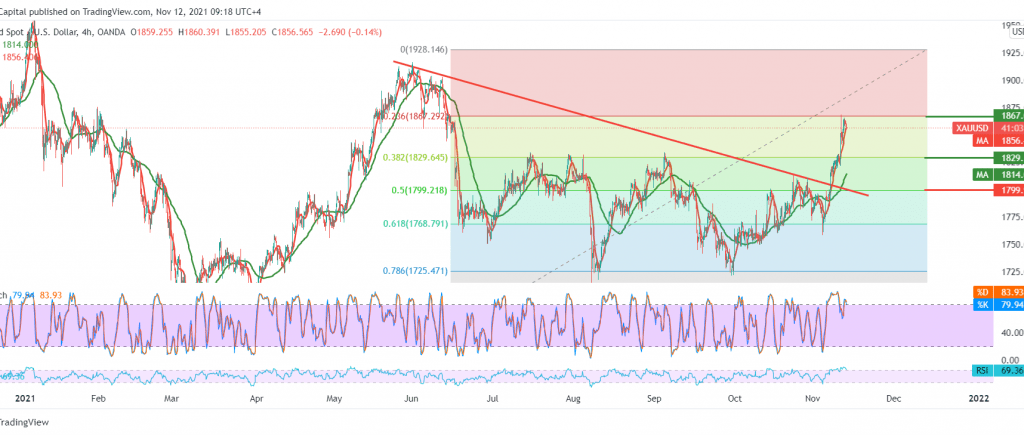
On the technical side, gold hit the 1867 resistance level represented by the 23.60% Fibonacci correction, which forced it to trade negatively again. However, looking at the 4-hour chart, we notice that the price is moving above the 50-day moving average and trading above the 1829 support level, 38.20% correction, which increases the possibility of the upside.
On the other hand, the clear negative signs on stochastic increase the possibility of witnessing a bearish bias in the coming hours due to overbought conditions to retest 1829.
With the conflict of technical signals, we will stay on the fence for the moment to obtain a high-quality deal to maintain the profit rates that were achieved during the previous trading sessions, waiting for one of the following scenarios:
Resuming the rise requires a clear and robust breach of the 1867 resistance level, 23.60% correction, contributing to consolidating gold’s gains towards 1890 initially.
Activating short positions requires price stability below the support level of 1829 and, most notably 1823, hence the chances of retesting 1799 50.0% Fibonacci retracement. Note: the level of risk is high.
| S1: 1843.00 | R1: 1868.00 |
| S2: 1829.00 | R2: 1878.00 |
| S3: 1819.00 | R3: 1891.00 |