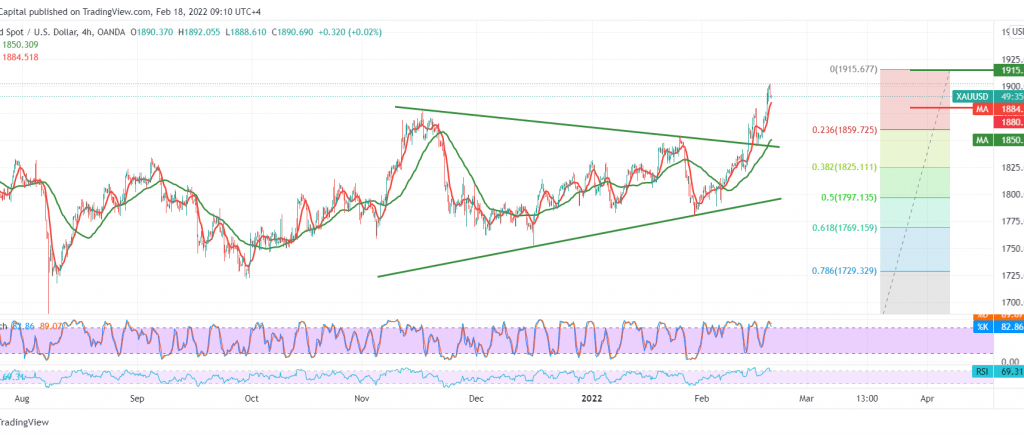
The yellow metal prices achieved noticeable gains during the previous trading session, attacking the psychological barrier of 1900 within the ascending path, in which we relied on consolidation above the level of 1878, explaining that push to visit 1892, recording the highest of 1901 during the early trading of the current session.
On the technical side today, by looking at the 4-hour chart, we notice that the 14-day momentum indicator continues to obtain positive signs and the success of gold price consolidation above 1880.
Therefore, resuming the bullish trend may be effective, provided that the 1905 breach is confirmed, and that may lead the price to retest the 1916 top, and gains may extend towards 1921 as long as the price is stable above 1880.
Sneaking below 1880 puts the price under negative pressure to visit 1870, and then the 1859 support level is represented by the 23.60% Fibonacci correction, as shown on the graph.
Note: the level of risk is still high.
Note: Trading on CFDs involves risks. Therefore, all scenarios may be possible. This article is not a recommendation to buy or sell but rather an explanatory reading of the price movement on the chart.
| S1: |
 Noor Trends News, Technical Analysis, Educational Tools and Recommendations

