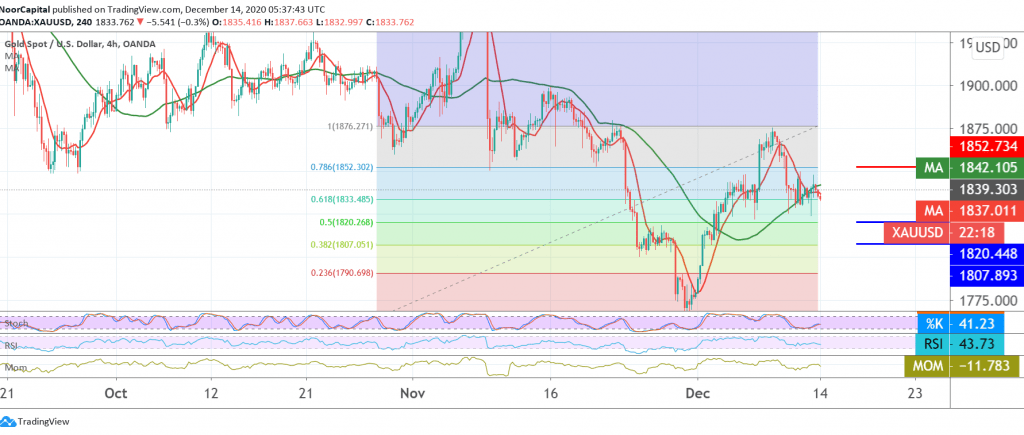
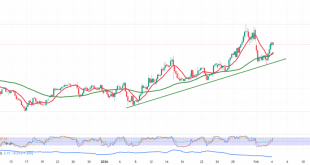
Trading tended to be negative during the last trading session last week, when gold prices touched the first target to be achieved, 1825, recording its lowest level at 1823.
Technically, despite the return of stability above the support floor of 1823, we find negative signs still dominating the stochastic, accompanied by negative signs coming from the RSI on short intervals.
From here, and with the continuation of trading below 1845/1850, the bearish tendency is likely today, given that the confirmation of the break of 1833 represented by the 61.80% Fibonacci retracement forces gold prices to enter a strong descending wave, whose initial target is 1820, the 50.0% correction, while its official target is 1807.
From the top, to move upwards and rise above 1845 and more importantly 1850 delay the chances of a reversal, and we witness a re-news of the pivotal resistance that tends to be the key to protecting the downside movement 1870.
| S1: 1822.00 | R1: 1845.00 |
| S2: 1811.00 | R2: 1857.00 |
| S3: 1800.00 | R3: 1868.00 |
 Noor Trends News, Technical Analysis, Educational Tools and Recommendations

