
During the previous trading session, Gold prices jumped within the expected bullish context in the last analysis. Therefore, we relied on confirming the 1981 breakthrough capable of extending gold’s gains to visit the first target in 1988 and then 2000, recording its highest level in 1999.
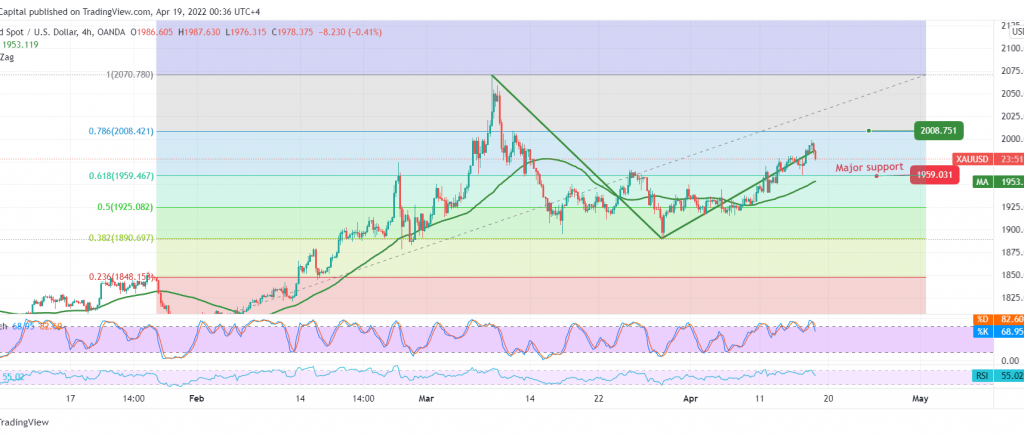
On the technical side today, and by looking at the 4-hour chart, we notice that the current trading is witnessing a bearish tendency, as a result of approaching the resistance level of the psychological barrier 2000, in addition to the stochastic indicator reaching the limits of overbought.
The daily trend is still bullish, with the stability of trading above the support floor of 1965 and, most importantly 1959 Fibonacci correction of 61.80%, knowing that the resumption of the upside depends mainly on consolidation above 2000, and that may increase the strength of the bullish trend so that we are waiting for 2008 next target and then 2018 official station deification.
Note: We may witness a bearish slope that aims to retest the above support levels before attempting to rise again.
Note: Declining below the support floor of 1959 might force gold to visit 1956 and 1950 initially.
Note: Trading on CFDs involves risks. Therefore, all scenarios may be possible. This article is not a recommendation to buy or sell but rather an explanatory reading of the price movement on the chart.
| S1: |