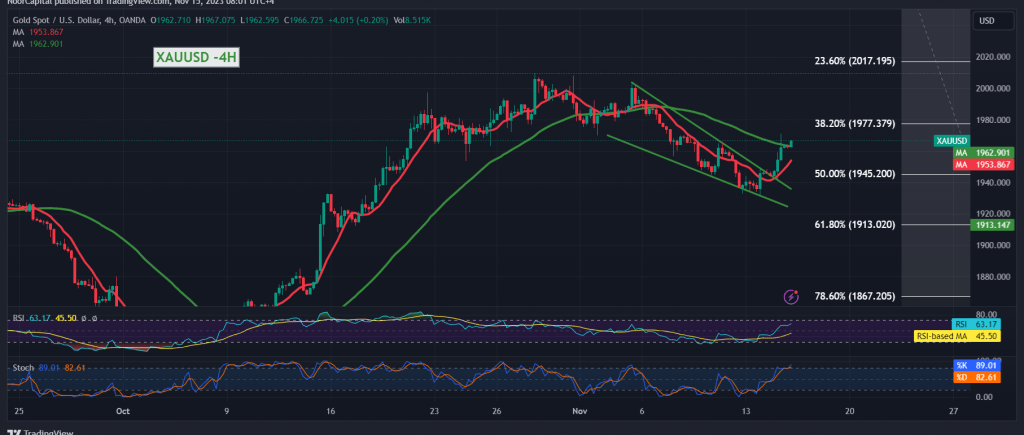
Gold prices have recently made significant strides, outperforming the US dollar, following a successful breach of the 1945 resistance level. This upward trend solidified as gold prices maintained stability above the 1954 mark. While this stability tempers the possibility of a downward shift, it doesn’t completely rule it out. We might see attempts to bounce back, potentially aiming to retest the 1962 and 1970 levels. The gold price even reached its zenith at 1971 dollars per ounce.
On the technical front, a glance at the 240-minute time frame chart reveals that the 50-day simple moving average is attempting to drive the price from below. This effort coincides with favourable signals from the relative strength index, as well as the steady trading above the previously breached resistance, now functioning as support at 1945, marking a 50.0% correction. In contrast, the Stochastic indicator has started showing negative signs, beginning to lose upward momentum, and there’s a persistent stability in trading below the crucial 1977 resistance point, indicating a 38.20% correction.
Given these mixed technical signals, our strategy is to closely monitor the price behaviour, aiming to secure a high-quality deal that will align with one of the following scenarios:
An upward crossing with the price solidifying above 1977 could bolster and hasten the upward trend, paving the way towards 1989 and 2007. Conversely, a failure to cross 1977 coupled with a return to stable trading below 1954 could trigger a bearish trend, possibly aiming to retest the 1945 level before deciding on the next price direction.
Please note that we are expecting significant economic data today from both the US and British economies. The US will be releasing the “Producer Price Index, Retail Sales, and New York State Manufacturing Index,” while the UK will be announcing “Annual Consumer Prices.” Be prepared for potential price fluctuations during these announcements.
Caution is advised as the risk level remains high due to ongoing geopolitical tensions, which may increase price volatility.
Note: Trading on CFDs involves risks. Therefore, all scenarios may be possible. This article is not a recommendation to buy or sell but rather an explanatory reading of the price movement on the chart.
| S1: |
 Noor Trends News, Technical Analysis, Educational Tools and Recommendations

