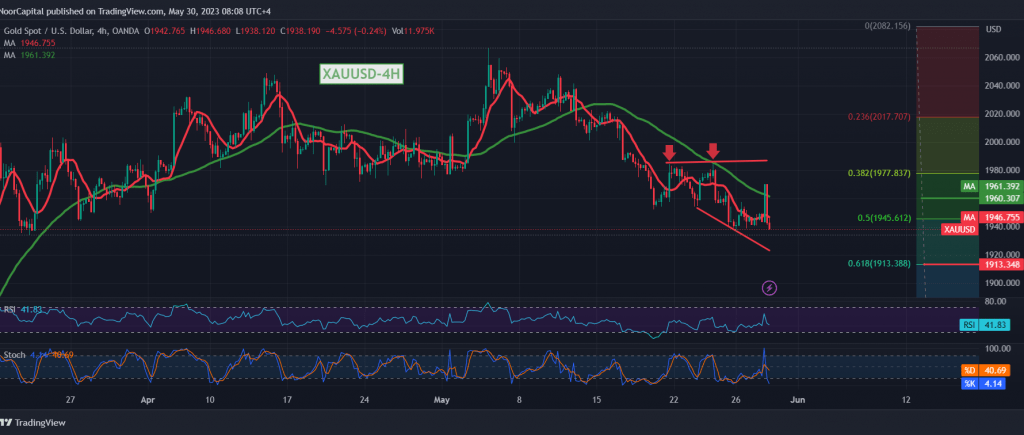
Gold prices continue to decline gradually to the downside within the expected bearish context, approaching achieving the first target of the previous analysis of 1935, to witness the current movements’ lowest level during the morning trading of today’s session, $1939 per ounce.
Today’s technical vision indicates the possibility of continuing the decline. With closer look at the 4-hour chart, we find that there is a continuation of the clear negative signs on the RSI stable below the mid-line 50, in addition to the negative pressure coming from the simple moving averages with a clear break of the 1945 support floor correction Fibonacci 50.0%.
Therefore, the bearish trend remains the most likely during today’s trading, targeting 1935, and breaking it will extend the losses, so that we will be waiting for 1928 and 1918, and after that 1913 correction of 61.80%, next waiting stations.
Activating the suggested scenario requires the constancy of daily trading below 1960, knowing that the price’s consolidation above it can temporarily thwart the bearish scenario We are witnessing a recovery in gold prices with the target of 1980.
Note: Today we are awaiting high-impact economic data issued by the US economy, “Consumer Confidence”, and we may witness high price fluctuations at the time of the news release.
Note: Trading on CFDs involves risks. Therefore, all scenarios may be possible. This article is not a recommendation to buy or sell but rather an explanatory reading of the price movement on the chart.
| S1: |
 Noor Trends News, Technical Analysis, Educational Tools and Recommendations

