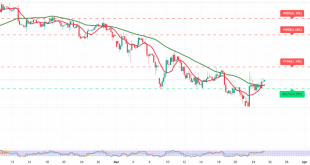
Gold prices (XAU/USD) managed to secure a daily close above the pivotal $5,000 resistance level, confirming the continuation of the broader uptrend and extending gains to a high near $5,086.
Technical Outlook – 4-Hour Chart
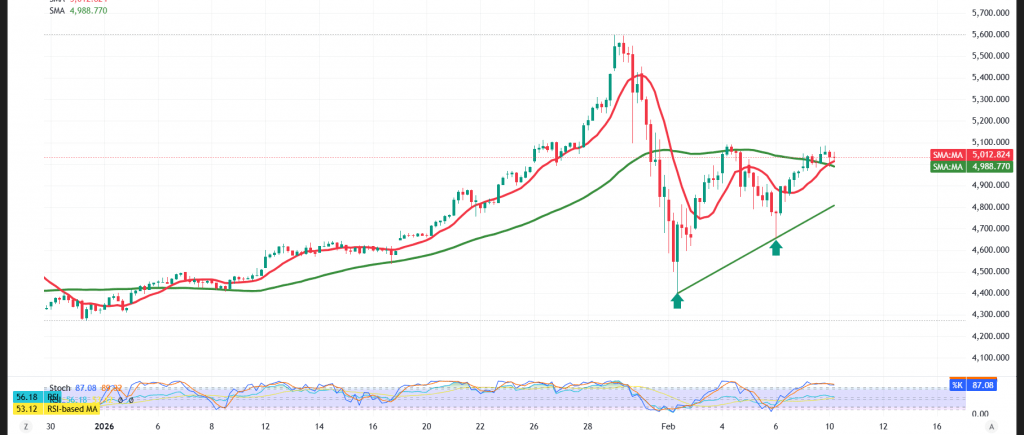
Daily Trend: Bullish
The daily trend remains clearly bullish, underpinned by price stability above the $5,000 level, which has now shifted from resistance to a key support zone following the breakout.
Strong Momentum with a Healthy Pullback
Intraday price action has seen a modest pullback as the Relative Strength Index (RSI) moved into overbought territory. This pause appears corrective in nature, reflecting a healthy attempt to ease overbought conditions rather than signaling a trend reversal.
Simple moving averages continue to provide strong dynamic support, preserving the short-term upward structure, with an internal bullish sub-wave still dominating the immediate timeframe.
Expected Scenario
The bullish trend is likely to persist during today’s session. A confirmed break above the $5,086 high would reinforce upside momentum and open the way toward the $5,145–$5,149 zone as the next initial targets.
On the downside, a return to trading below the $5,000 level would increase downside risks, potentially triggering a corrective move toward $4,970 and then $4,910 before the next directional assessment.
Market Note:
High-impact U.S. economic data is due today, including monthly Retail Sales and the Employment Cost Index. Elevated volatility is expected around the release.
Risk Warnings:
- Gold trading carries a relatively high level of risk and may not be suitable for all investors.
- Ongoing trade and geopolitical tensions continue to heighten uncertainty, leaving all scenarios possible.
Risk Disclaimer: Trading CFDs involves risks, and therefore all scenarios may be plausible. The content above is not a recommendation to sell or buy but rather an explanatory reading of price movement on the chart.
| S1: 4970.00 | R1: 5091.00 |
| S2: 4910.00 | R2: 5149.00 |
| S3: 4850.00 | R3: 5212.00 |