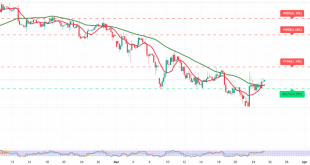
Gold prices have exhibited notable volatility in recent sessions; however, short-term bullish momentum has regained traction following a successful break above the $4,500 level, signaling an attempt to re-establish the broader upward trend.
Technical Outlook – 4-Hour Timeframe:
Daily Trend: Bullish
The higher timeframe structure remains firmly supportive of the upside, with the prevailing daily trend continuing to favor buyers.
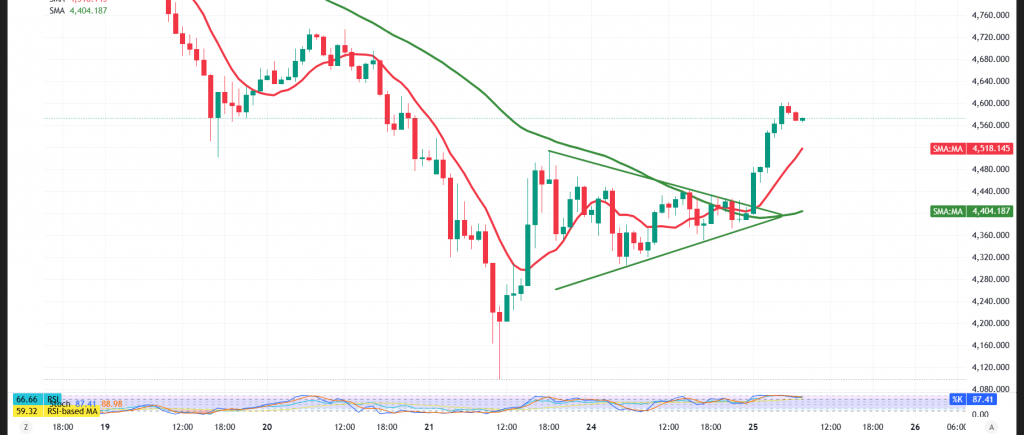
Momentum indicators present a mixed but constructive picture. The Relative Strength Index (RSI) is holding in positive territory, albeit within overbought levels—suggesting the possibility of a near-term pause or mild corrective pullback driven by profit-taking.
At the same time, price action remains below key simple moving averages, representing a limiting factor for sustained upside continuation in the immediate term. This divergence between momentum and trend indicators highlights a phase of short-term indecision.
Positive Scenario:
A confirmed break above the 4,610 level would reinforce bullish control and signal a continuation of the upward move, opening the way toward the initial target at 4,680.
Negative Scenario:
Failure to reclaim higher levels and sustained trading below 4,473 would increase downside pressure, potentially triggering a corrective move toward 4,383 as the first bearish target.
Overall, gold is currently trading within a state of equilibrium between bullish momentum and corrective forces. Price behavior around these key levels will be critical in determining the next directional move.
Risk Disclaimer:
Gold remains a high-risk asset under current market conditions, particularly amid ongoing trade uncertainties and geopolitical tensions. Elevated volatility implies that multiple scenarios remain plausible, and positions should be managed with caution.
Risk Disclaimer: Trading CFDs involves risks, and therefore all scenarios may be plausible. The content above is not a recommendation to sell or buy but rather an explanatory reading of price movement on the chart.
| S1: 4383.00 | R1: 4680.00 |
| S2: 4195.00 | R2: 4790.00 |
| S3: 4085.00 | R3: 4977.00 |