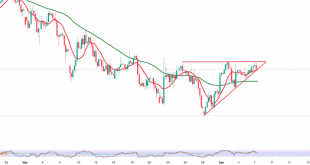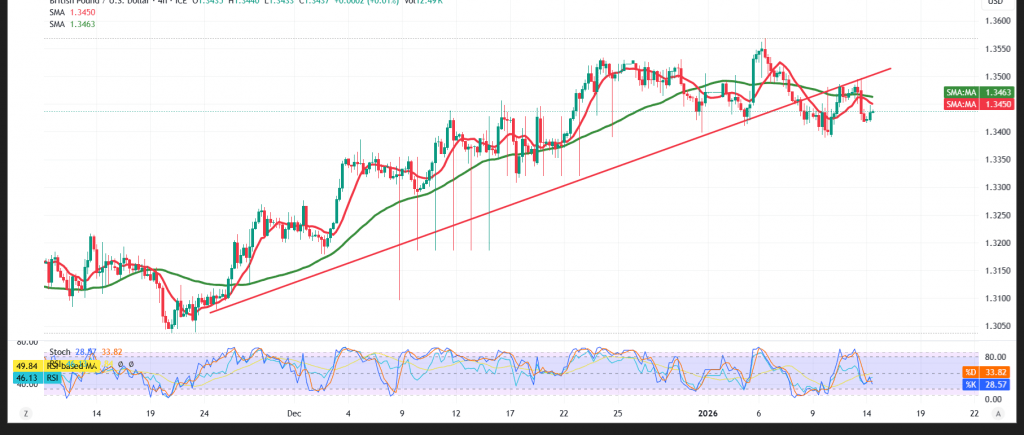
The GBP/USD pair has shifted into negative territory after topping near the 1.3500 area in the previous session, signaling a loss of bullish momentum.
Technical Outlook – 4-Hour Chart
Price has slipped back below the simple moving averages, which are now acting as dynamic resistance. This technical shift is reinforced by bearish signals on the Relative Strength Index (RSI), alongside a clear break of the ascending trend line — both pointing to growing downside pressure.
As long as price action remains capped below the 1.3500 resistance zone, the risk of further declines persists. The first downside target stands near 1.3400, and a break below this level would likely extend losses toward 1.3370.
On the upside, a recovery scenario would require a sustained move back above 1.3500. In that case, the pair could attempt a rebound toward 1.3530, followed by 1.3560.
Market Note:
High-impact U.S. economic data is due today, particularly the monthly Producer Price Index (PPI) and Retail Sales figures. Elevated volatility is expected around the release.
Risk Warning:
Market conditions remain high-risk amid ongoing trade and geopolitical tensions, and all scenarios remain possible.
Trading CFDs involves risks, and therefore all scenarios may be plausible. The information provided above is not a recommendation to sell or buy but rather an explanatory reading of price movement on the chart.
| S1: 1.3405 | R1: 1.3485 |
| S2: 1.3370 | R2: 1.3530 |
| S3: 1.3320 | R3: 1.3560 |