The EUR/USD pair posted only modest gains in the previous session, briefly touching the 1.1700 area — a key psychological level — before failing to sustain momentum above it. The pair subsequently showed early signs of short-term weakness.
Technical Outlook – 4-Hour Chart
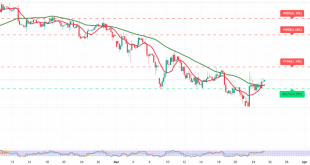
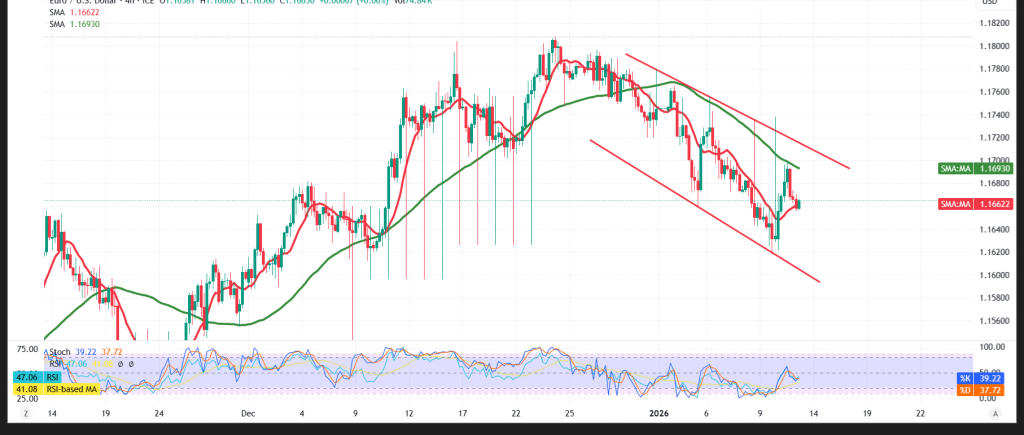
The 1.1700 level has proven to be a firm resistance zone, pushing the pair into a short-term bearish phase. Simple moving averages continue to cap upside attempts, acting as dynamic resistance and keeping downside pressure intact.
Momentum indicators are aligning with this view. The Relative Strength Index (RSI) is rolling over from elevated levels, hinting at fading bullish momentum and increasing the probability of a corrective pullback.
Expected Technical Path
As long as price action remains below 1.1700 and trades within the descending corrective channel, the bearish bias remains dominant. The first downside target stands at 1.1625. A break below this level would likely accelerate losses, opening the door toward 1.1585.
On the other hand, an hourly close above 1.1700 would signal a potential recovery attempt, with scope for a move toward 1.1740.
Market Note:
High-impact U.S. economic data is due today, most notably the monthly and annual Consumer Price Index (CPI). Elevated volatility is expected around the release, which could trigger sharp moves across dollar pairs.
Risk Disclaimer: Trading CFDs involves risks, and therefore the scenarios outlined above are not a recommendation to sell or buy but rather an explanatory reading of price movement on the chart.
| S1: 1.1625 | R1: 1.1700 |
| S2: 1.1580 | R2: 1.1740 |
| S3: 1.1545 | R3: 1.1780 |