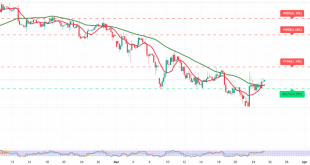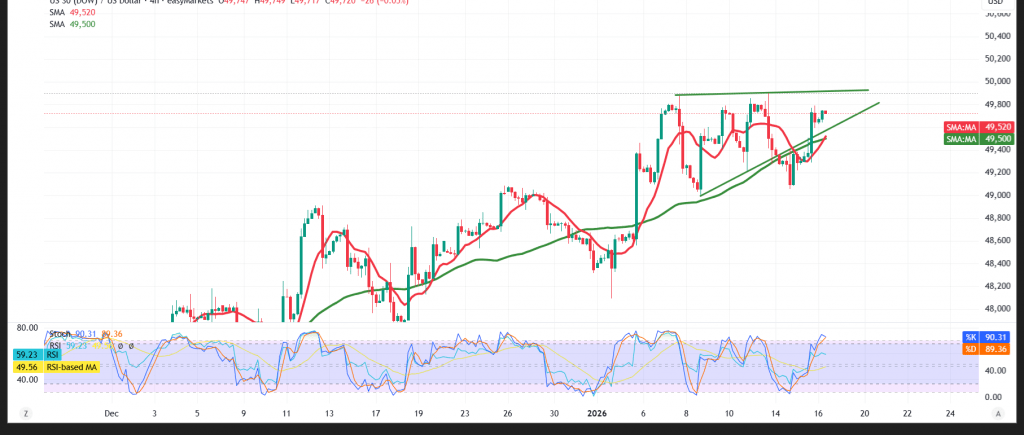
The Dow Jones Industrial Average found firm support near the 49,290 level, prompting a technical rebound and stabilizing price action.
Technical Outlook – 4-Hour Chart
Price holding above the 50-period Simple Moving Average continues to favor the bullish structure. In addition, the Relative Strength Index (RSI) has returned to positive territory, reflecting a recovery in momentum and reinforcing the strength of the upward move.
Expected Scenario
As long as daily trading remains above the 49,480 support level, the bullish bias stays intact, with 49,920 standing as the next upside target. A confirmed break above this level would further strengthen and accelerate the upward trend, opening the way toward 50,100, provided no return below 49,480 occurs.
Caution:
- Current market conditions carry a high level of risk, which may not be commensurate with potential returns.
- Ongoing trade and geopolitical tensions continue to elevate uncertainty, leaving all scenarios possible.
Trading in CFDs involves risks, and therefore all scenarios are subject to potential outcomes. The analysis provided above is not a recommendation to buy or sell but rather an illustrative reading of price action on the chart.
| S1: 49410 | R1: 49920 |
| S2: 49095 | R2: 50100 |
| S3: 48910 | R3: 50415 |