The Dow Jones Industrial Average posted a historic advance, closing above the 50,000 level for the first time ever and reaching a peak near 50,323, underscoring strong bullish momentum.
Technical Analysis – 4-Hour Chart
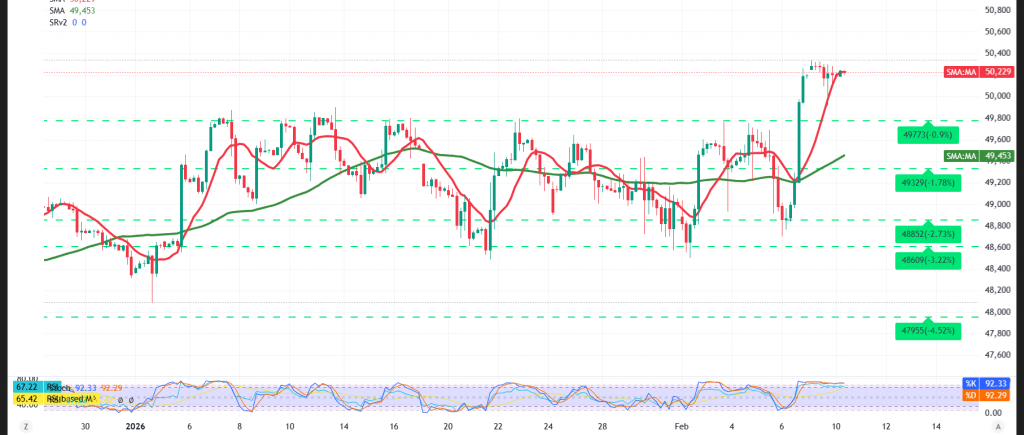
Price action continues to trade comfortably above the simple moving averages, supporting the continuation of the upward trend. In addition, the confirmed breakout above the psychological 50,000 level — which has now shifted from resistance to a key support zone under the principle of role reversal — further reinforces the bullish structure.
Likely Scenario
As long as daily trading remains above the 50,000 level, the bullish opportunity remains valid and active. Under this scenario, the index is expected to target 50,390 initially. A confirmed break above this level would strengthen and accelerate the uptrend, opening the way toward 50,560, with potential extension toward the 51,000 milestone at a later stage.
On the downside, a return to trading below the 50,000 level would delay the bullish scenario and could trigger a temporary corrective pullback, with scope for a retest of 49,975 followed by 49,740.
Market Note:
High-impact U.S. economic data is due today, including monthly Retail Sales and the Employment Cost Index, which may trigger elevated volatility.
Risk Warning:
Market conditions remain high-risk amid ongoing trade and geopolitical tensions, and all scenarios remain possible.
Trading in CFDs involves risks, and therefore all scenarios are subject to potential outcomes. The analysis provided above is not a recommendation to buy or sell but rather an illustrative reading of price action on the chart.
| S1: 49975 | R1: 50390 |
| S2: 49735 | R2: 50560 |
| S3: 49565 | R3: 50800 |