Dow Jones Industrial Average Technical Analysis
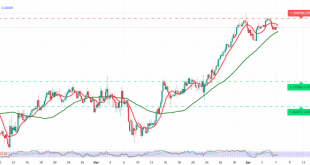
A bearish trend has taken hold of the Dow Jones Industrial Average on Wall Street after the index encountered a key resistance level near 47,055, capping the recent recovery attempt.
Technical Outlook
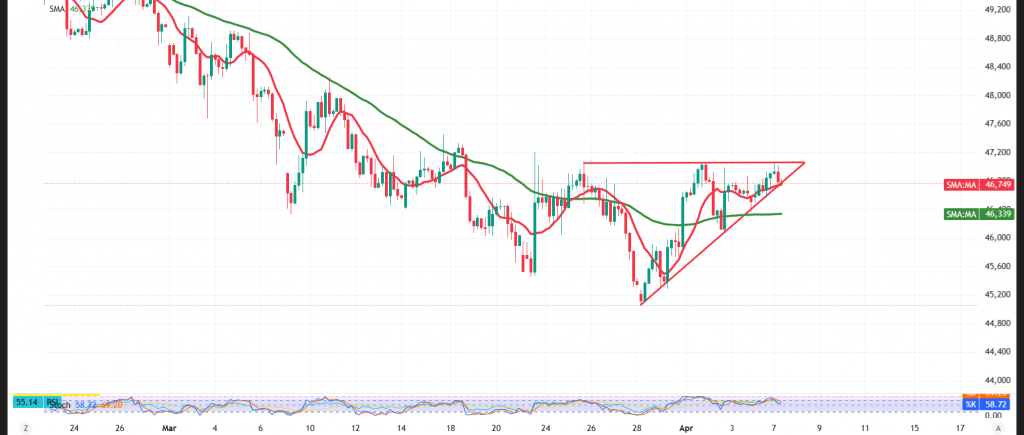
Price remains below the 50-day simple moving average, which continues to act as overhead resistance and increases the probability of further downside. This is reinforced by the RSI settling below the midline of 50, reflecting a lack of bullish momentum and a tilt toward selling pressure.
Key Levels to Watch
With daily price action holding below 47,055, the bearish bias is the preferred scenario for today’s session, targeting 46,600 as a first objective, with the possibility of losses extending toward 46,570 if selling pressure intensifies. On the other hand, a sustained recovery back above 47,055 would invalidate the bearish outlook and put the index on course for a rebound toward 47,295.
Risk Warning: Trading carries a high level of risk amid ongoing trade and geopolitical tensions — all scenarios remain possible and sound risk management is essential.
Trading in CFDs involves risks, and therefore all scenarios are subject to potential outcomes. The analysis provided above is not a recommendation to buy or sell but rather an illustrative reading of price action on the chart.
| S1: 46570 | R1: 47055 |
| S2: 46330 | R2: 47295 |
| S3: 46085 | R3: 47535 |