The Dow Jones Industrial Average came under notable selling pressure in the previous session, retreating on Wall Street after a series of consecutive gains.
Technical Outlook – 4-Hour Chart
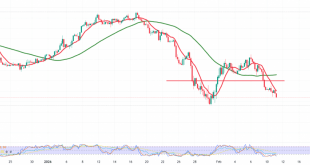
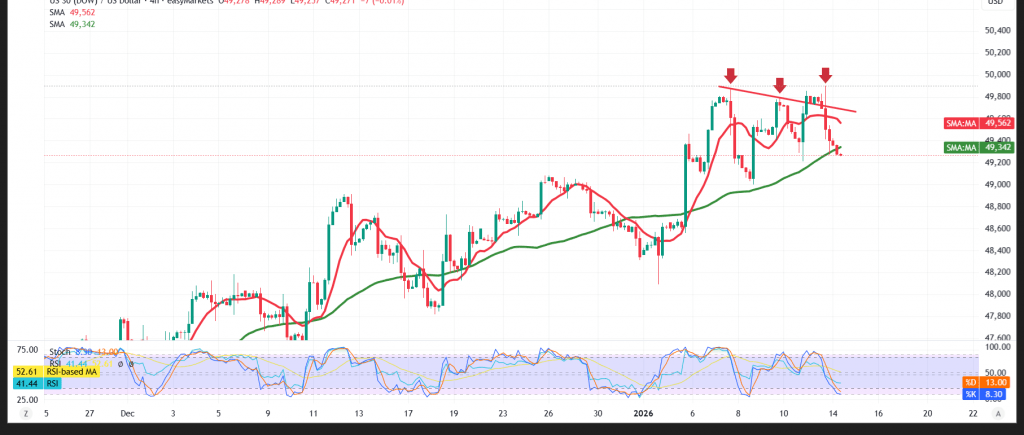
The pullback reflects profit-taking following the index’s advance toward the 49,900 area. Simple moving averages have shifted back into a bearish configuration, applying downward pressure on price action. This is accompanied by a clear loss of momentum and negative signals on the Relative Strength Index (RSI), pointing to growing downside risk in the short term.
Expected Scenario
As long as daily trading remains capped below the 49,440 resistance level, the downside scenario remains the most likely path. A confirmed break below the 49,190 support level would further reinforce bearish momentum, opening the door for a decline toward the 49,050 area.
Market Note:
High-impact U.S. economic data is due today, particularly the Producer Price Index (PPI) and Retail Sales figures. Elevated volatility is expected around the release.
Risk Warnings:
- Current market conditions carry a high level of risk, which may not be commensurate with potential returns.
- Ongoing trade and geopolitical tensions continue to heighten uncertainty, leaving all scenarios possible.
Trading in CFDs involves risks, and therefore all scenarios are subject to potential outcomes. The analysis provided above is not a recommendation to buy or sell but rather an illustrative reading of price action on the chart.
| S1: 49045 | R1: 49690 |
| S2: 48830 | R2: 50110 |
| S3: 48400 | R3: 50330 |