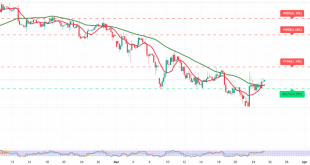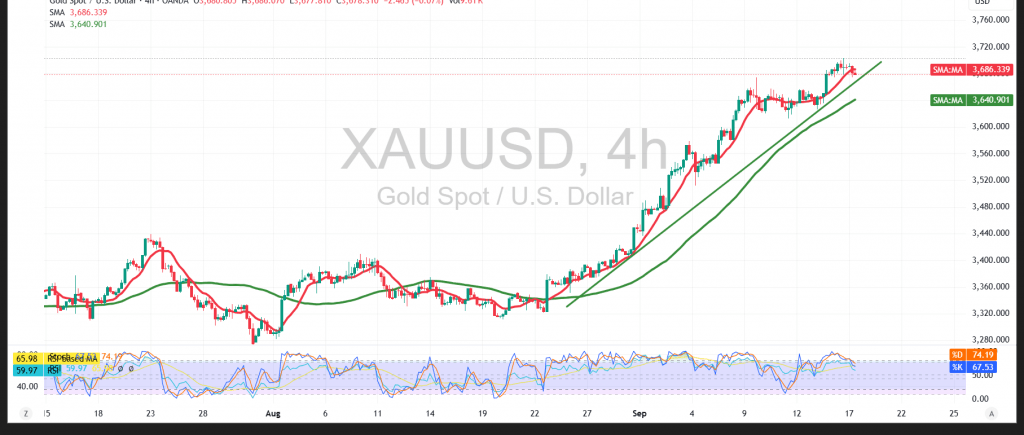
Gold (XAU/USD) Technical Analysis – 4H Chart
Gold prices extended their bullish momentum in the last session, reaching the first target at $3,705 and printing a session high of $3,703 per ounce, setting a fresh all-time record.
Technical Outlook:
- After touching the $3,700 psychological barrier, intraday price action showed a normal corrective pullback on profit-taking.
- The RSI has exited its overbought zone and dipped towards relatively oversold areas compared to price action, a move that could ease selling pressure and support renewed buying demand.
- The 50-period SMA continues to act as dynamic support, helping sustain the overall bullish bias.
Probable Scenario:
- The uptrend remains intact while trading above the $3,667 pivotal support.
- A confirmed break above the recent high at $3,703 would strengthen bullish momentum, opening the way towards $3,714, and potentially $3,726 as the next resistance targets.
Alternative Scenario:
- A break below $3,667 and sustained trading under this level could trigger corrective selling pressure, with downside scope to test $3,656, before buyers attempt to reassert control.
Risk Note: Traders should prepare for heightened volatility today, with several key U.S. events on deck: the FOMC statement, the Fed’s economic outlook, the Fed Chair’s press conference, and the Federal Funds Rate decision.
Risk Disclaimer: Trading CFDs involves risks, and therefore all scenarios may be plausible. The content above is not a recommendation to sell or buy but rather an explanatory reading of price movement on the chart.
| S1: 3668.00 | R1: 3697.00 |
| S2: 3656.00 | R2: 3714.00 |
| S3: 3639.00 | R3: 3726.00 |