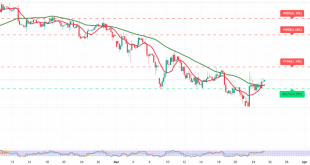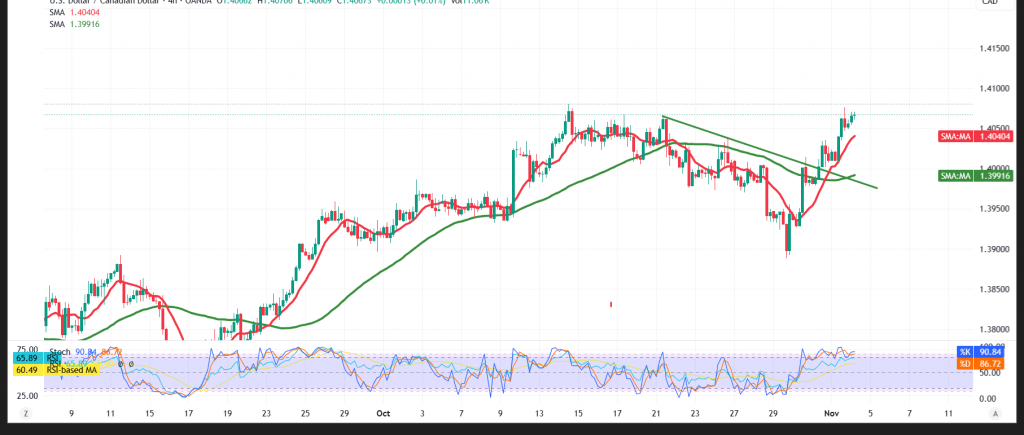
The bullish setup remains intact: price has held above the 1.4000 psychological floor, hit our first target at 1.4040, and printed a 1.4076 high.
Technical outlook
- Structure: A break above the descending trendline is holding.
- SMAs: Simple moving averages have rotated beneath price, providing support.
- RSI: Easing from overbought without breaking down—consistent with scope for further upside.
Base case (bullish while above 1.4000)
- Maintaining acceptance above 1.4000 keeps momentum constructive toward 1.4095.
- A decisive break/4H close above 1.4095 would likely extend to 1.4120.
Alternative / pullback
- A 4H close back below 1.4000 would soften the bias and favor a retest of 1.3970 before buyers attempt to reassert control.
Risk note
Volatility is elevated amid trade and geopolitical headlines. Use prudent position sizing and firm stops; reassess quickly if these key levels give way.
Trading in CFDs involves risks, and therefore all scenarios are subject to potential outcomes. The analysis provided above is not a recommendation to buy or sell but rather an illustrative reading of price action on the chart.
| S1: 1.4020 | R1: 1.4095 |
| S2: 1.3970 | R2: 1.4120 |
| S3: 1.3940 | R3: 1.4170 |